Misc
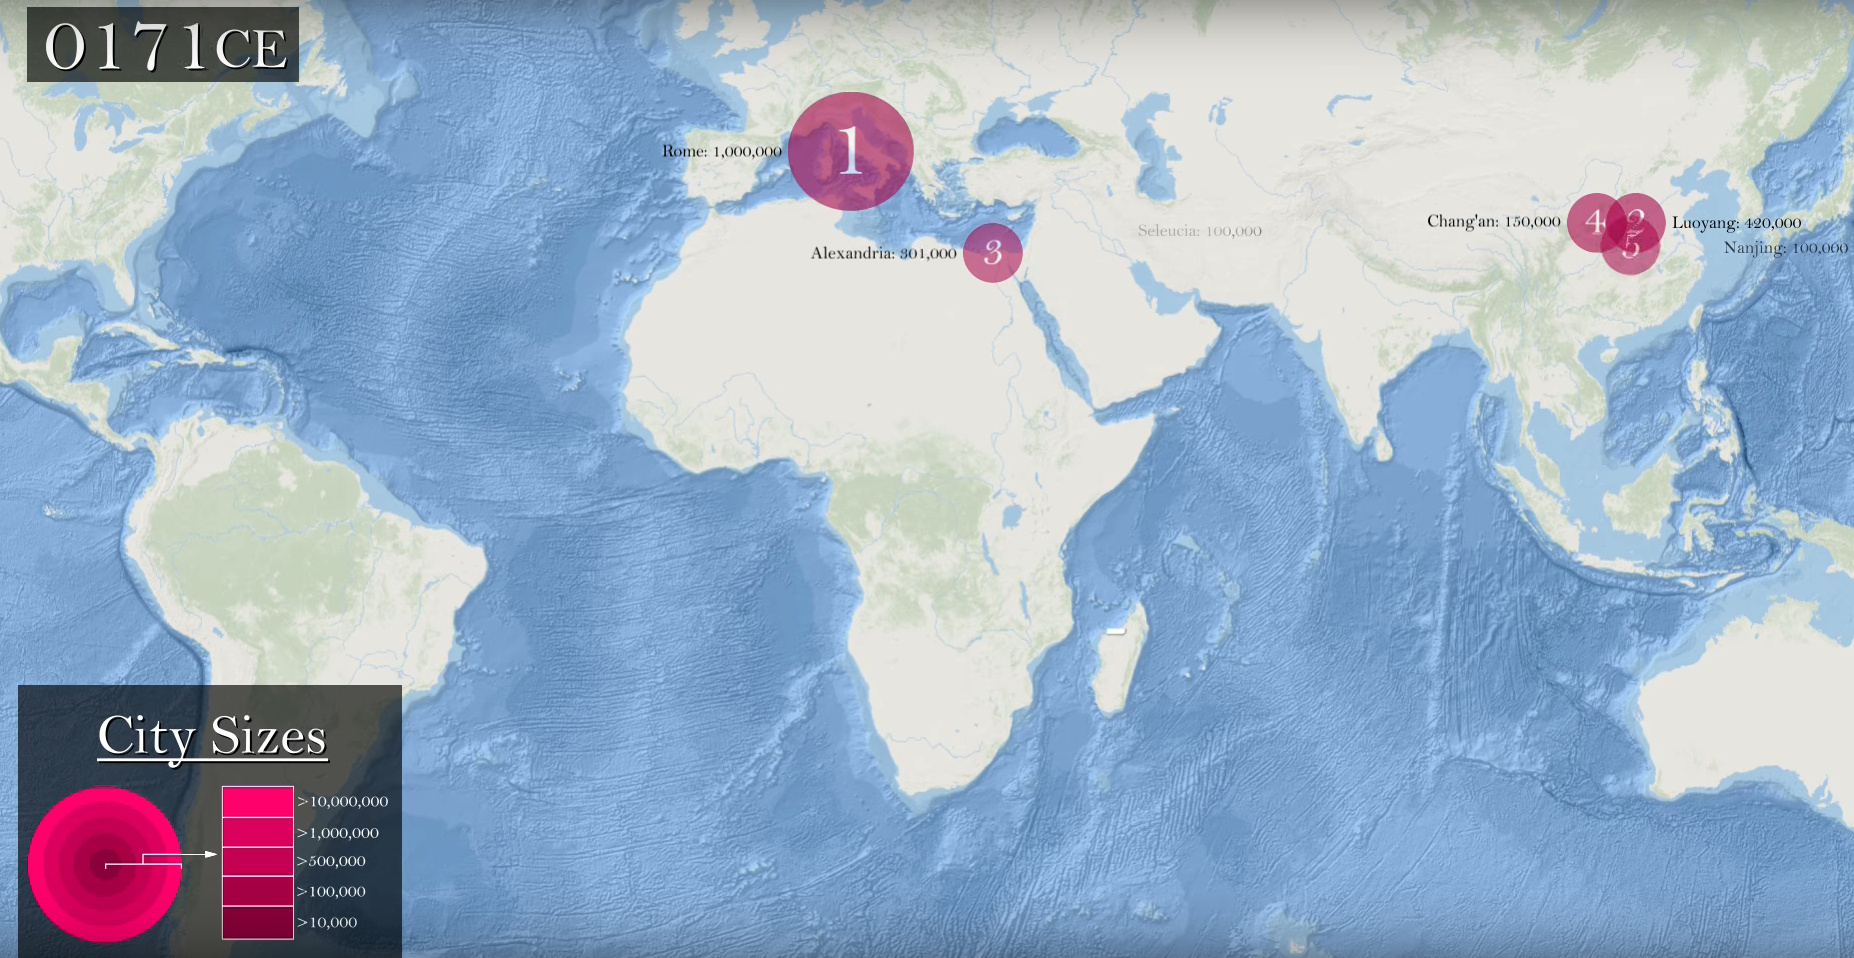
Video: The 5 Largest Cities Throughout the Course of History
The world’s most influential cities have certain attributes that make them appear timeless.
Metropolises like New York City, Hong Kong, Shanghai, and London have unprecedented size, opportunities, economic might, and cultural significance, that it’s easy to imagine them as permanent and unparalleled fixtures on the world stage.
However, any glance at world history shows us immediately that these places are not as exceptional or as timeless as we would like to think. Over time, it seems that even the most important cities eventually fall or slip in status.
That’s why a glance at the record books can be humbling, as we come across the names of many ancient cities that were the most important during their time – places like Luoyang, Ctesiphon, Pataliputra, and Constantinople – that today, the majority of people are much less familiar with.
The 5 Largest Cities Over Time
Today we present to you two videos from the Ollie Bye Youtube channel that show the rapidly changing history of the world’s top cities by population.
It’s incredible to watch the rise and fall of these cities, especially when we’re talking about the centers that were the undisputed heavyweight champions of their day.
The 5 Largest Cities (Years: 3000 BC to 1600 AD)
Over this massive span of time, the designation of the world’s most populous city shifts 16 times.
Rome keeps the title for an impressive period – over 400 years – while Baghdad and Chinese cities also have impressive runs as well. However, what’s most provoking about the video is the list of lesser-known cities that have held the title, such as Chang’an, Merv (Marv), and Pi-Ramesses.
The 5 Largest Cities (Years: 1600 to 2100)
During this much shorter stretch of time of more modern history, the rate of urbanization is skyrocketing and cities are now growing at exponential rates.
The most populous city shifts nine times – and by the year 2100, it’s projected that the five most populous cities could have 370 million people living between them.
This would be higher than the total population of the entire world in the 12th century.


Misc
How Hard Is It to Get Into an Ivy League School?
We detail the admission rates and average annual cost for Ivy League schools, as well as the median SAT scores required to be accepted.


How Hard Is It to Get Into an Ivy League School?
This was originally posted on our Voronoi app. Download the app for free on iOS or Android and discover incredible data-driven charts from a variety of trusted sources.
Ivy League institutions are renowned worldwide for their academic excellence and long-standing traditions. But how hard is it to get into one of the top universities in the U.S.?
In this graphic, we detail the admission rates and average annual cost for Ivy League schools, as well as the median SAT scores required to be accepted. The data comes from the National Center for Education Statistics and was compiled by 24/7 Wall St.
Note that “average annual cost” represents the net price a student pays after subtracting the average value of grants and/or scholarships received.
Harvard is the Most Selective
The SAT is a standardized test commonly used for college admissions in the United States. It’s taken by high school juniors and seniors to assess their readiness for college-level academic work.
When comparing SAT scores, Harvard and Dartmouth are among the most challenging universities to gain admission to. The median SAT scores for their students are 760 for reading and writing and 790 for math. Still, Harvard has half the admission rate (3.2%) compared to Dartmouth (6.4%).
| School | Admission rate (%) | SAT Score: Reading & Writing | SAT Score: Math | Avg Annual Cost* |
|---|---|---|---|---|
| Harvard University | 3.2 | 760 | 790 | $13,259 |
| Columbia University | 3.9 | 750 | 780 | $12,836 |
| Yale University | 4.6 | 760 | 780 | $16,341 |
| Brown University | 5.1 | 760 | 780 | $26,308 |
| Princeton University | 5.7 | 760 | 780 | $11,080 |
| Dartmouth College | 6.4 | 760 | 790 | $33,023 |
| University of Pennsylvania | 6.5 | 750 | 790 | $14,851 |
| Cornell University | 7.5 | 750 | 780 | $29,011 |
*Costs after receiving federal financial aid.
Additionally, Dartmouth has the highest average annual cost at $33,000. Princeton has the lowest at $11,100.
While student debt has surged in the United States in recent years, hitting $1.73 trillion in 2023, the worth of obtaining a degree from any of the schools listed surpasses mere academics. This is evidenced by the substantial incomes earned by former students.
Harvard grads, for example, have the highest average starting salary in the country, at $91,700.

-

 Real Estate2 weeks ago
Visualizing America’s Shortage of Affordable Homes
-

 Technology1 week ago
Ranked: Semiconductor Companies by Industry Revenue Share
-

 Money1 week ago
Which States Have the Highest Minimum Wage in America?
-

 Real Estate1 week ago
Ranked: The Most Valuable Housing Markets in America
-

 Business2 weeks ago
Charted: Big Four Market Share by S&P 500 Audits
-

 AI2 weeks ago
The Stock Performance of U.S. Chipmakers So Far in 2024
-

 Misc2 weeks ago
Almost Every EV Stock is Down After Q1 2024
-

 Money2 weeks ago
Where Does One U.S. Tax Dollar Go?