Markets
The Top Importers and Exporters of the World’s 18 Most Traded Goods
View a high resolution version of this graphic
The Top Importers and Exporters of the World’s 18 Most Traded Goods
View the high resolution version of today’s graphic by clicking here.
Every day, massive quantities of goods get traded on the global market.
These goods can be entirely customized and unique, but more often they are things like commodities or bulk goods that get moved around on huge container ships from country to country. Included in this latter category would be common exports like crude oil, automobiles, iron ore, pharmaceuticals, and smartphones.
Which goods get traded the most, and what countries play the most important roles in these deals?
The Most Traded Goods
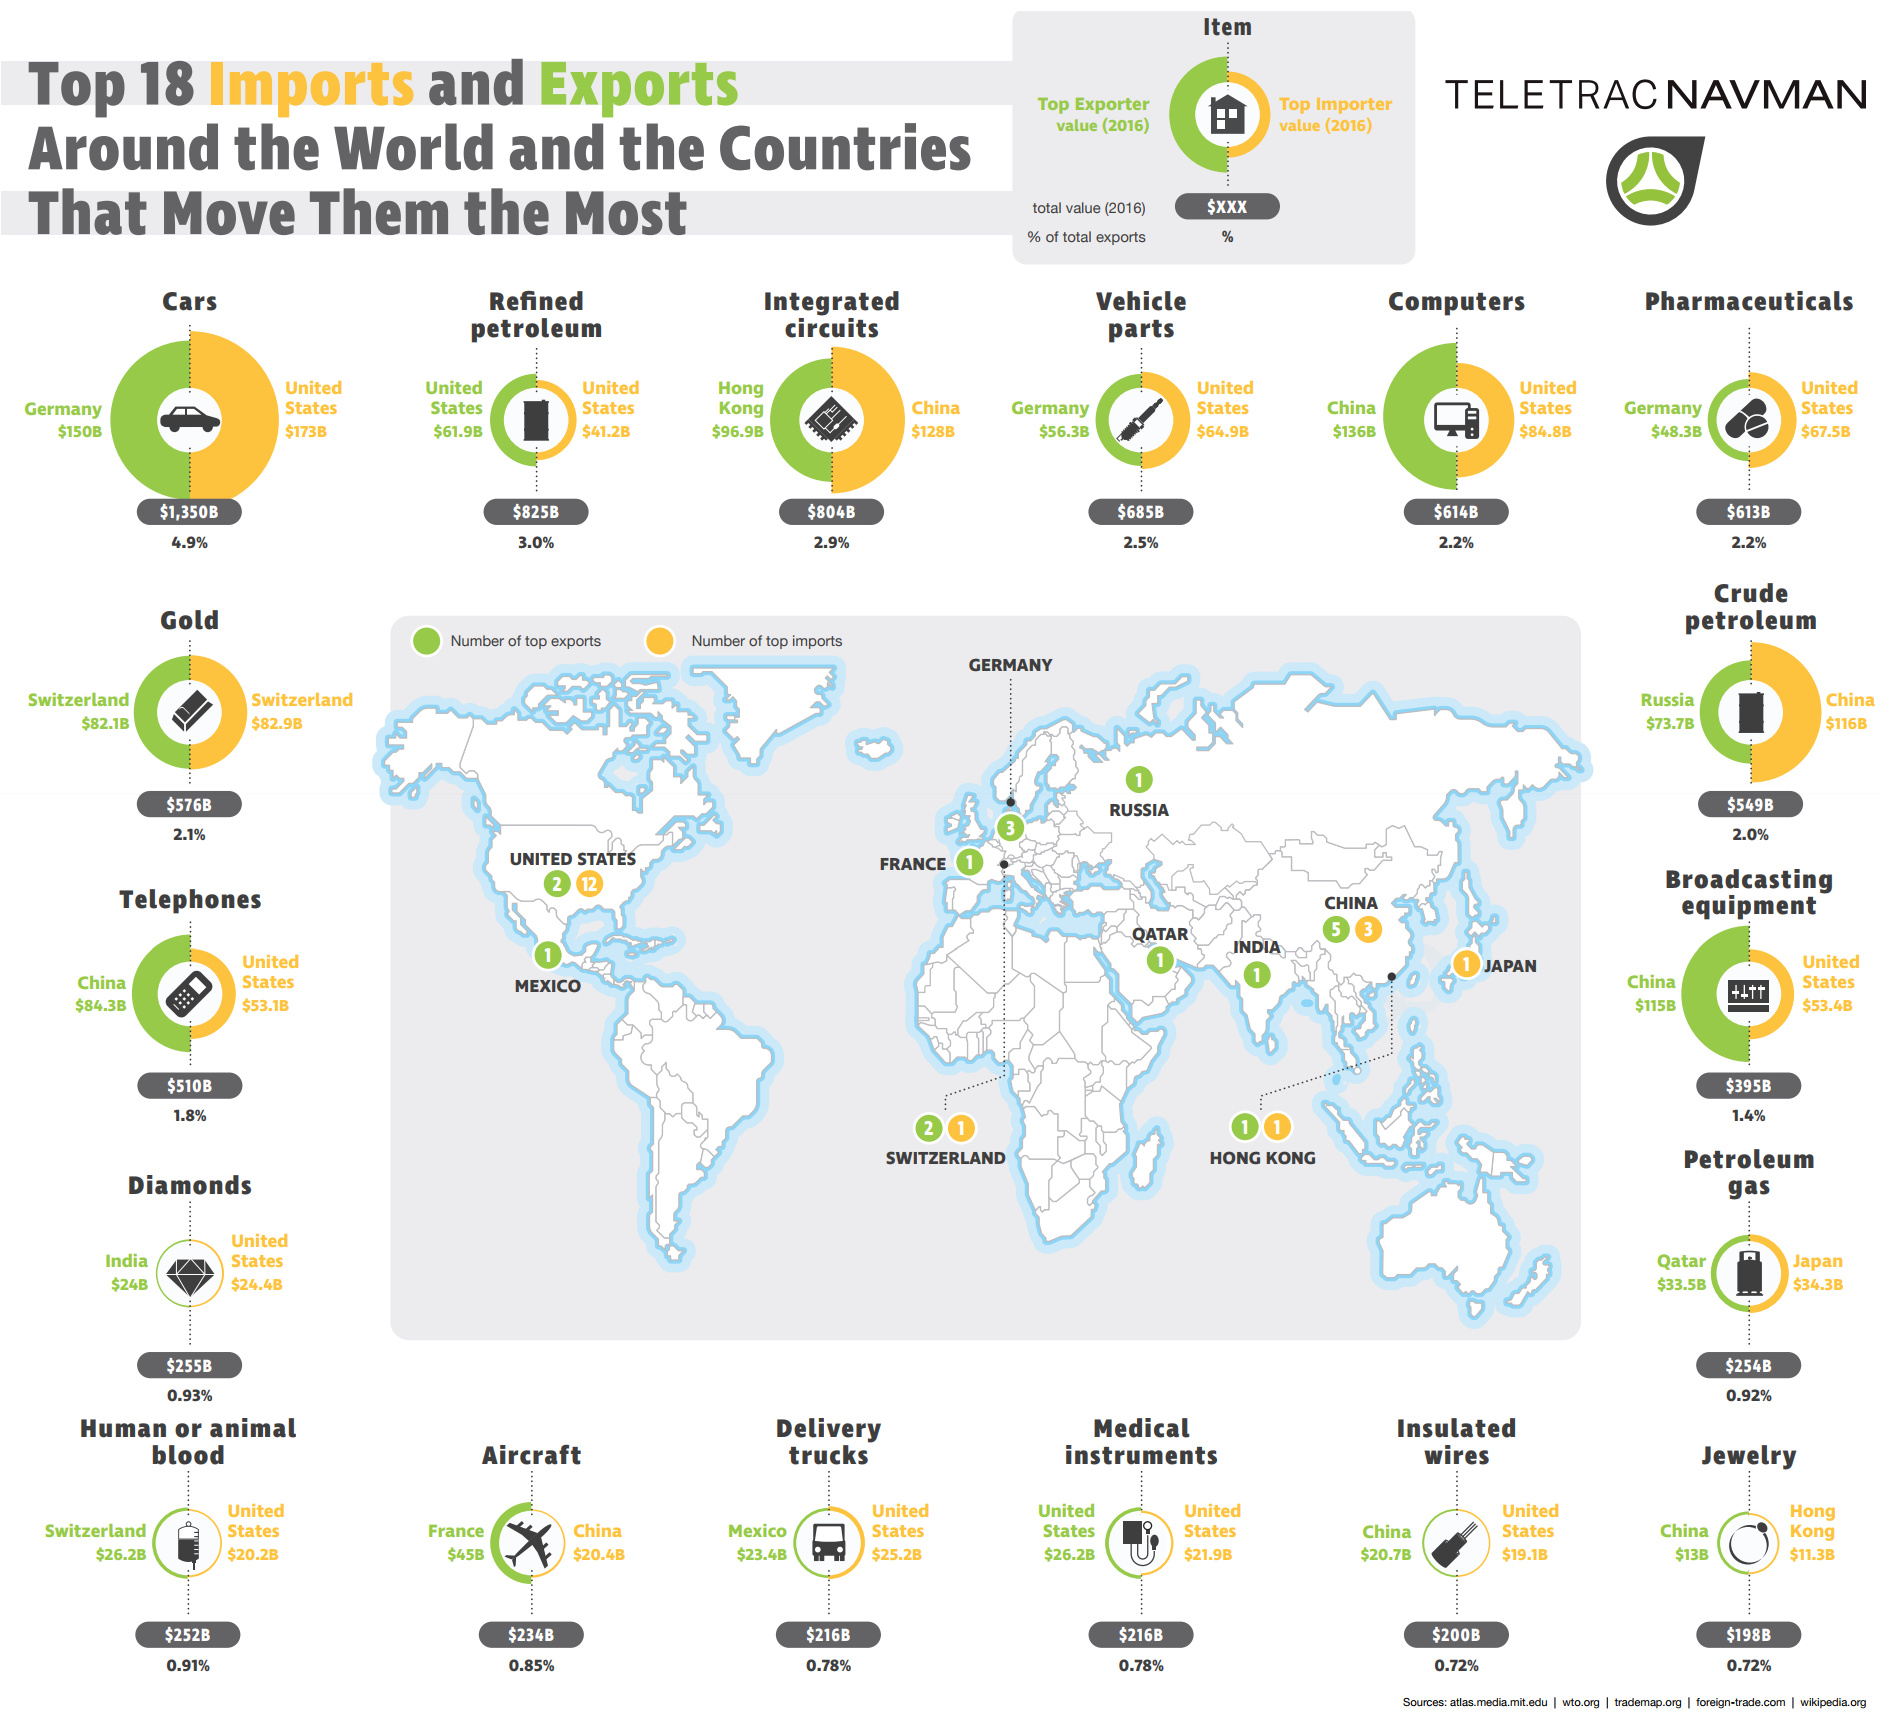
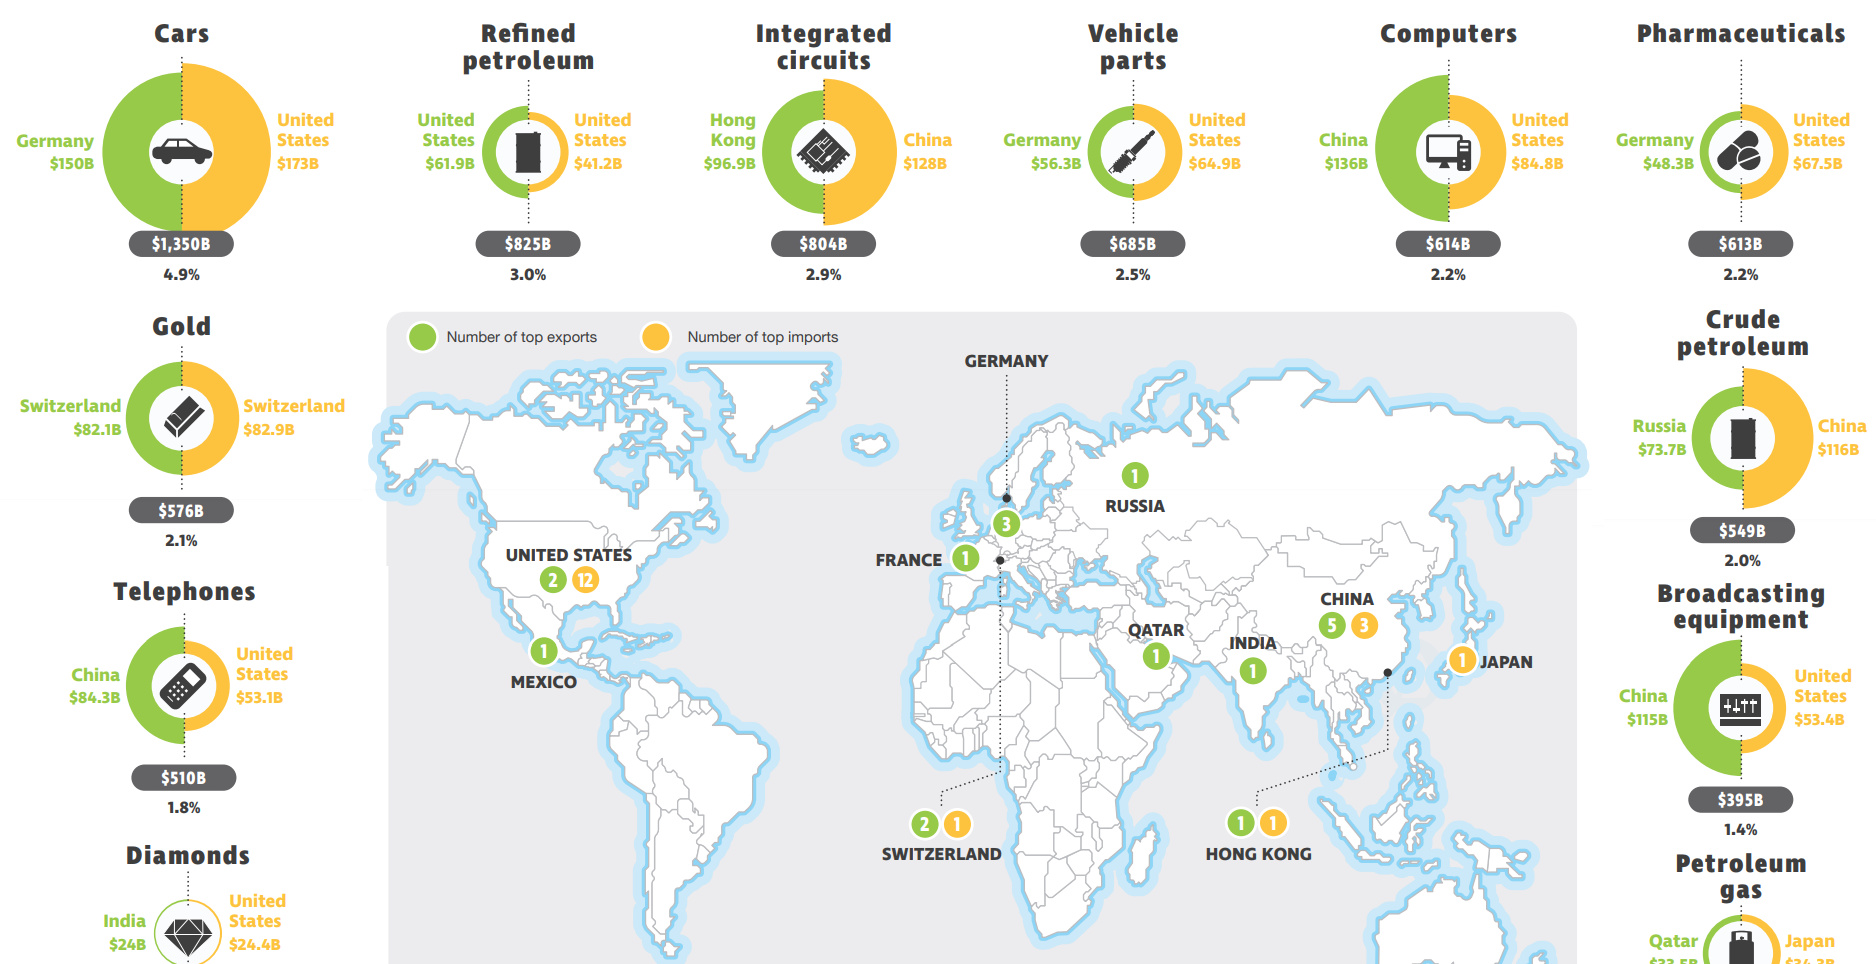
Today’s infographic comes to us from Teletrac Navman and it covers the world’s 18 most traded goods, as well as the top importer and exporter for each good.
Here are the good categories, along with the total dollar value and percentage of total exports that each category represents on the global market.
| Rank | Category of Good | Total Value (2016) | % of Total Global Exports |
|---|---|---|---|
| #1 | Cars | $1,350 billion | 4.9% |
| #2 | Refined Petroleum | $825 billion | 3.0% |
| #3 | Integrated Circuits | $804 billion | 2.9% |
| #4 | Vehicle Parts | $685 billion | 2.5% |
| #5 | Computers | $614 billion | 2.2% |
| #6 | Pharmaceuticals | $613 billion | 2.2% |
| #7 | Gold | $576 billion | 2.1% |
| #8 | Crude Petroleum | $549 billion | 2.0% |
| #9 | Telephones | $510 billion | 1.8% |
| #10 | Broadcasting Equipment | $395 billion | 1.4% |
| #11 | Diamonds | $255 billion | 0.9% |
| #12 | Petroleum Gas | $254 billion | 0.9% |
| #13 | Human or Animal Blood | $252 billion | 0.9% |
| #14 | Aircraft | $234 billion | 0.9% |
| #15 | Delivery Trucks | $216 billion | 0.8% |
| #16 | Medical Instruments | $216 billion | 0.8% |
| #17 | Insulated Wires | $200 billion | 0.7% |
| #18 | Jewelry | $198 billion | 0.7% |
Finished automobiles are the top good traded worldwide with $1.35 trillion being traded each year between countries. Auto parts are not far behind in the #4 spot with $685 billion of trade.
Oil also stands out as a key commodity: refined petroleum ranks #2 with $825 billion of trade, while crude petroleum and petroleum gas are at #8 and #12, for $549 billion and $254 billion traded, respectively.
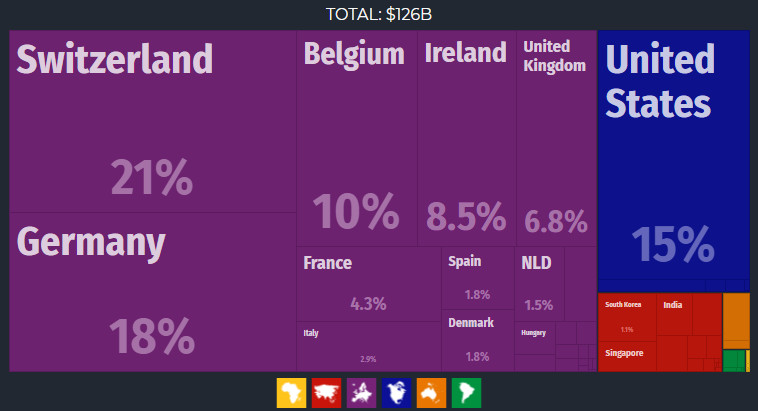
Finally, an odd standout is the category of human and animal blood – which apparently sees $252 billion in aggregate international trade each year.
In case you were wondering, here are the top exporters of human and animal blood:
Key Importers and Exporters
The United States is the biggest importer for 12 of the 18 trade categories, including the largest ones: automobiles and refined petroleum.
Interestingly, the U.S. is also the largest exporter of two of the goods that it is a top importer of: refined petroleum and medical equipment. This is because both are highly specialized categories – the U.S. may import one grade of refined oil at a low cost, while simultaneously exporting a higher or more specialized grade of oil at a premium.
Germany is a top exporter of autos, vehicle parts, and pharmaceuticals, while Switzerland is the number one importer and exporter of gold.
Lastly, China is the biggest exporter for five of the 18 trade categories: computers, broadcasting equipment, telephones, insulated wires, and jewelry, while being the largest importer of crude oil, integrated circuits, and aircraft.


Markets
U.S. Debt Interest Payments Reach $1 Trillion
U.S. debt interest payments have surged past the $1 trillion dollar mark, amid high interest rates and an ever-expanding debt burden.


U.S. Debt Interest Payments Reach $1 Trillion
This was originally posted on our Voronoi app. Download the app for free on iOS or Android and discover incredible data-driven charts from a variety of trusted sources.
The cost of paying for America’s national debt crossed the $1 trillion dollar mark in 2023, driven by high interest rates and a record $34 trillion mountain of debt.
Over the last decade, U.S. debt interest payments have more than doubled amid vast government spending during the pandemic crisis. As debt payments continue to soar, the Congressional Budget Office (CBO) reported that debt servicing costs surpassed defense spending for the first time ever this year.
This graphic shows the sharp rise in U.S. debt payments, based on data from the Federal Reserve.
A $1 Trillion Interest Bill, and Growing
Below, we show how U.S. debt interest payments have risen at a faster pace than at another time in modern history:
| Date | Interest Payments | U.S. National Debt |
|---|---|---|
| 2023 | $1.0T | $34.0T |
| 2022 | $830B | $31.4T |
| 2021 | $612B | $29.6T |
| 2020 | $518B | $27.7T |
| 2019 | $564B | $23.2T |
| 2018 | $571B | $22.0T |
| 2017 | $493B | $20.5T |
| 2016 | $460B | $20.0T |
| 2015 | $435B | $18.9T |
| 2014 | $442B | $18.1T |
| 2013 | $425B | $17.2T |
| 2012 | $417B | $16.4T |
| 2011 | $433B | $15.2T |
| 2010 | $400B | $14.0T |
| 2009 | $354B | $12.3T |
| 2008 | $380B | $10.7T |
| 2007 | $414B | $9.2T |
| 2006 | $387B | $8.7T |
| 2005 | $355B | $8.2T |
| 2004 | $318B | $7.6T |
| 2003 | $294B | $7.0T |
| 2002 | $298B | $6.4T |
| 2001 | $318B | $5.9T |
| 2000 | $353B | $5.7T |
| 1999 | $353B | $5.8T |
| 1998 | $360B | $5.6T |
| 1997 | $368B | $5.5T |
| 1996 | $362B | $5.3T |
| 1995 | $357B | $5.0T |
| 1994 | $334B | $4.8T |
| 1993 | $311B | $4.5T |
| 1992 | $306B | $4.2T |
| 1991 | $308B | $3.8T |
| 1990 | $298B | $3.4T |
| 1989 | $275B | $3.0T |
| 1988 | $254B | $2.7T |
| 1987 | $240B | $2.4T |
| 1986 | $225B | $2.2T |
| 1985 | $219B | $1.9T |
| 1984 | $205B | $1.7T |
| 1983 | $176B | $1.4T |
| 1982 | $157B | $1.2T |
| 1981 | $142B | $1.0T |
| 1980 | $113B | $930.2B |
| 1979 | $96B | $845.1B |
| 1978 | $84B | $789.2B |
| 1977 | $69B | $718.9B |
| 1976 | $61B | $653.5B |
| 1975 | $55B | $576.6B |
| 1974 | $50B | $492.7B |
| 1973 | $45B | $469.1B |
| 1972 | $39B | $448.5B |
| 1971 | $36B | $424.1B |
| 1970 | $35B | $389.2B |
| 1969 | $30B | $368.2B |
| 1968 | $25B | $358.0B |
| 1967 | $23B | $344.7B |
| 1966 | $21B | $329.3B |
Interest payments represent seasonally adjusted annual rate at the end of Q4.
At current rates, the U.S. national debt is growing by a remarkable $1 trillion about every 100 days, equal to roughly $3.6 trillion per year.
As the national debt has ballooned, debt payments even exceeded Medicaid outlays in 2023—one of the government’s largest expenditures. On average, the U.S. spent more than $2 billion per day on interest costs last year. Going further, the U.S. government is projected to spend a historic $12.4 trillion on interest payments over the next decade, averaging about $37,100 per American.
Exacerbating matters is that the U.S. is running a steep deficit, which stood at $1.1 trillion for the first six months of fiscal 2024. This has accelerated due to the 43% increase in debt servicing costs along with a $31 billion dollar increase in defense spending from a year earlier. Additionally, a $30 billion increase in funding for the Federal Deposit Insurance Corporation in light of the regional banking crisis last year was a major contributor to the deficit increase.
Overall, the CBO forecasts that roughly 75% of the federal deficit’s increase will be due to interest costs by 2034.

-

 Real Estate2 weeks ago
Visualizing America’s Shortage of Affordable Homes
-

 Technology1 week ago
Ranked: Semiconductor Companies by Industry Revenue Share
-

 Money1 week ago
Which States Have the Highest Minimum Wage in America?
-

 Real Estate1 week ago
Ranked: The Most Valuable Housing Markets in America
-

 Business1 week ago
Charted: Big Four Market Share by S&P 500 Audits
-

 AI2 weeks ago
The Stock Performance of U.S. Chipmakers So Far in 2024
-

 Misc2 weeks ago
Almost Every EV Stock is Down After Q1 2024
-

 Money2 weeks ago
Where Does One U.S. Tax Dollar Go?