Technology
The Top Downloaded Apps in 2022


The Top Downloaded Apps in 2022
Whether they’re providing a service like ride-sharing or acting as a mere source of entertainment, mobile apps have become an integral part of many peoples’ day-to-day lives.
But which apps are most popular among users?
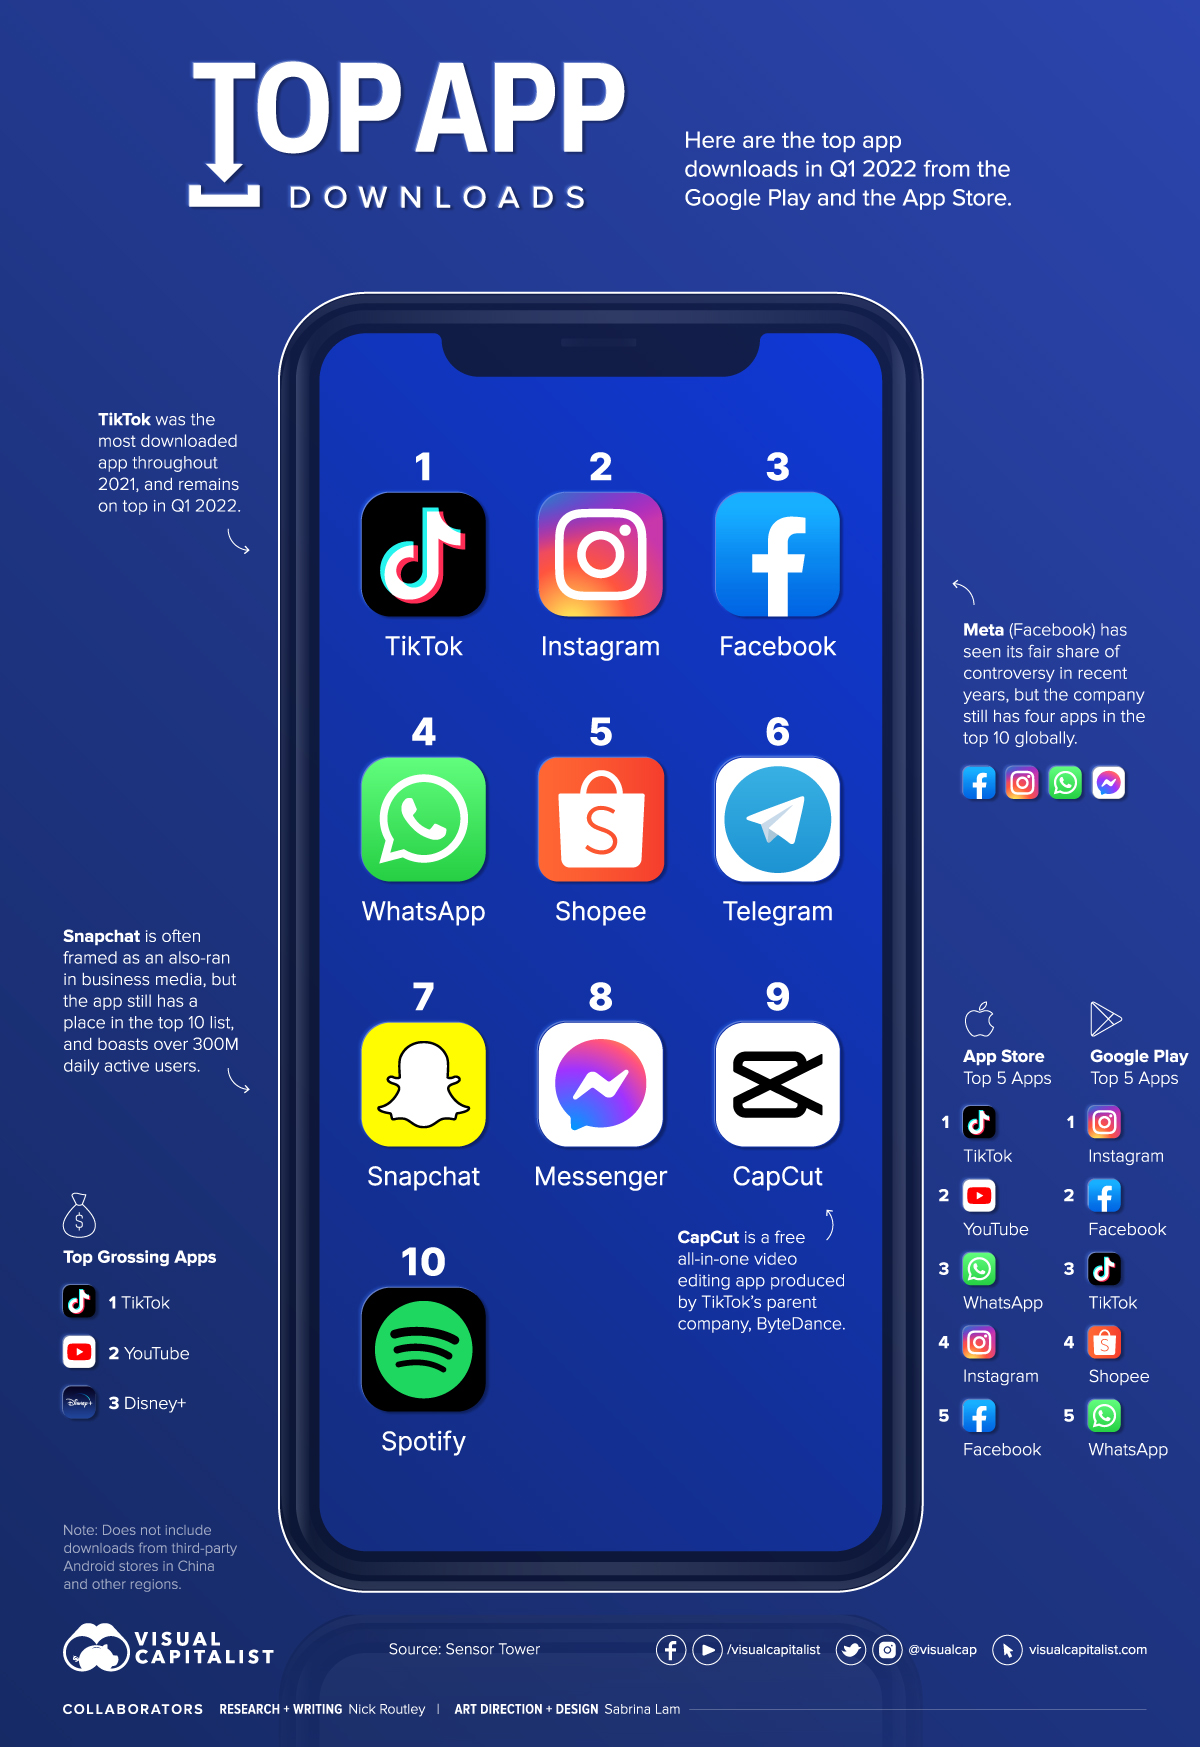
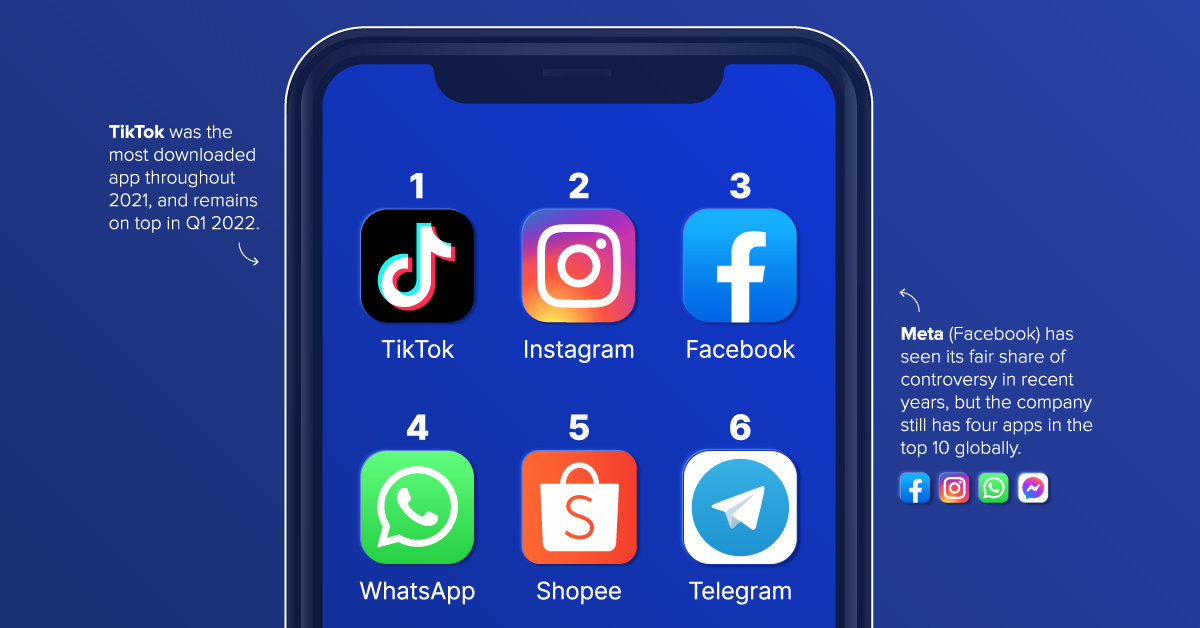
This graphic uses data from a recent report by Sensor Tower to show the top 10 most downloaded apps around the world in Q1 2022 from the Google Play and Apple App Store.
Social Reigns Supreme
According to the report, total app downloads reached 36.9 billion in Q1 2022, a 1.4% increase compared to Q1 2021.
A majority of the top 10 most downloaded apps were social media platforms, with Meta and ByteDance owning six of the top 10.
| Rank | App | Category |
|---|---|---|
| 1 | TikTok | Entertainment |
| 2 | Photo and video | |
| 3 | Social networking | |
| 4 | Messaging | |
| 5 | Shopee | Shopping |
| 6 | Telegram | Messaging |
| 7 | Snapchat | Photo and video |
| 8 | Messenger | Messaging |
| 9 | CapCut | Photo and video |
| 10 | Spotify | Music |
Meta’s four platforms on the list are Instagram, Facebook, WhatsApp, and Messenger, while ByteDance owns TikTok and video-editing platform CapCut.
Just outside the top 10 are Zoom and WhatsApp Business (yet another Meta-owned app).
TikTok’s Winding Road to the Top
In Q1 2021, TikTok exceeded 3.5 billion all-time downloads, becoming the fifth app (and the first non-Meta app) to reach this milestone. This is impressive considering the app has been banned in India as of June 2020. Prior to the ban, India accounted for 30% of TikTok’s downloads.
India’s not the only country that’s banned the use of TikTok. Pakistan has blocked TikTok multiple times because of concerns over “inappropriate” content. However, it’s worth noting that the bans in Pakistan only lasted a few days before being lifted, and currently, Pakistanis are able to access the platform.
Top 10 Highest Grossing Apps
TikTok isn’t just the most downloaded app in the world—it’s also the highest-grossing non-game app, based on Q1 2022 revenue from the App Store and Google Play:
| Rank | App | Category |
|---|---|---|
| 1 | TikTok | Entertainment |
| 2 | YouTube | Photo and video |
| 3 | Disney+ | Entertainment |
| 4 | Google One | Productivity |
| 5 | Tinder | Lifestyle |
| 6 | Piccoma | Books |
| 7 | Tencent Video | Entertainment |
| 8 | iQIYI | Entertainment |
| 9 | HBO Max | Entertainment |
| 10 | LINE Manga | Entertainment |
TikTok generated an impressive $821 million in consumer spending in the last quarter. The video-sharing platform was the top-grossing app on the App Store, and the second-highest-grossing on Google Play, coming just after Google One.
While none of Meta’s platforms made it onto the top 10 list for gross revenue, these platforms make a ton of money that doesn’t necessarily flow through app stores. In 2021, Meta generated more than $117.9 billion in revenue, with over 97% of that coming from ads.
Growth’s on the Horizon
The pandemic had a massive impact on the app market.
In 2020, app spending on things like premium access, in-app purchases, and subscriptions surged by 30% year-over-year to reach $111 billion.
And while COVID-19 restrictions are easing in most places around the world, app spending isn’t likely to taper off anytime soon. By 2025, spending is expected to grow to $270 billion.


Technology
Visualizing AI Patents by Country
See which countries have been granted the most AI patents each year, from 2012 to 2022.


Visualizing AI Patents by Country
This was originally posted on our Voronoi app. Download the app for free on iOS or Android and discover incredible data-driven charts from a variety of trusted sources.
This infographic shows the number of AI-related patents granted each year from 2010 to 2022 (latest data available). These figures come from the Center for Security and Emerging Technology (CSET), accessed via Stanford University’s 2024 AI Index Report.
From this data, we can see that China first overtook the U.S. in 2013. Since then, the country has seen enormous growth in the number of AI patents granted each year.
| Year | China | EU and UK | U.S. | RoW | Global Total |
|---|---|---|---|---|---|
| 2010 | 307 | 137 | 984 | 571 | 1,999 |
| 2011 | 516 | 129 | 980 | 581 | 2,206 |
| 2012 | 926 | 112 | 950 | 660 | 2,648 |
| 2013 | 1,035 | 91 | 970 | 627 | 2,723 |
| 2014 | 1,278 | 97 | 1,078 | 667 | 3,120 |
| 2015 | 1,721 | 110 | 1,135 | 539 | 3,505 |
| 2016 | 1,621 | 128 | 1,298 | 714 | 3,761 |
| 2017 | 2,428 | 144 | 1,489 | 1,075 | 5,136 |
| 2018 | 4,741 | 155 | 1,674 | 1,574 | 8,144 |
| 2019 | 9,530 | 322 | 3,211 | 2,720 | 15,783 |
| 2020 | 13,071 | 406 | 5,441 | 4,455 | 23,373 |
| 2021 | 21,907 | 623 | 8,219 | 7,519 | 38,268 |
| 2022 | 35,315 | 1,173 | 12,077 | 13,699 | 62,264 |
In 2022, China was granted more patents than every other country combined.
While this suggests that the country is very active in researching the field of artificial intelligence, it doesn’t necessarily mean that China is the farthest in terms of capability.
Key Facts About AI Patents
According to CSET, AI patents relate to mathematical relationships and algorithms, which are considered abstract ideas under patent law. They can also have different meaning, depending on where they are filed.
In the U.S., AI patenting is concentrated amongst large companies including IBM, Microsoft, and Google. On the other hand, AI patenting in China is more distributed across government organizations, universities, and tech firms (e.g. Tencent).
In terms of focus area, China’s patents are typically related to computer vision, a field of AI that enables computers and systems to interpret visual data and inputs. Meanwhile America’s efforts are more evenly distributed across research fields.
Learn More About AI From Visual Capitalist
If you want to see more data visualizations on artificial intelligence, check out this graphic that shows which job departments will be impacted by AI the most.

-

 Markets1 week ago
U.S. Debt Interest Payments Reach $1 Trillion
-

 Business2 weeks ago
Charted: Big Four Market Share by S&P 500 Audits
-

 Real Estate2 weeks ago
Ranked: The Most Valuable Housing Markets in America
-

 Money2 weeks ago
Which States Have the Highest Minimum Wage in America?
-

 AI2 weeks ago
Ranked: Semiconductor Companies by Industry Revenue Share
-

 Markets2 weeks ago
Ranked: The World’s Top Flight Routes, by Revenue
-

 Demographics2 weeks ago
Population Projections: The World’s 6 Largest Countries in 2075
-

 Markets2 weeks ago
The Top 10 States by Real GDP Growth in 2023