Technology
The Top 20 Tech Companies by Revenue Per Employee
The Top 20 Tech Companies by Revenue Per Employee
Whether the goal is to organize the world’s information or to build an algorithm that makes millions of lives easier, pretty much every tech company in existence aims to leverage software in some way to do the types of jobs that would otherwise be impossible or uneconomical for humans to do.
Tapping into the properties of the digital world allows these companies to do more with less. They can have global reach with minimal infrastructure, massive scale with little overhead, and impressive revenues without any physical inventory.
Tech companies can even “provide” a service by simply connecting people through a platform, rather than knowing how to perform the service itself.
“Our Greatest Asset”
With this kind of scale, every action taken by an employee packs an extra punch to have an effect on company performance. It’s why companies like Google, Facebook, and Microsoft are willing to pay an arm and a leg for the smartest engineers. These teams are not physically turning out widgets in a factory under the constraints of normal economic factors – instead, they are applying their brains to a codebase, and even the tiniest cost savings can add up when multiplied by millions of users.
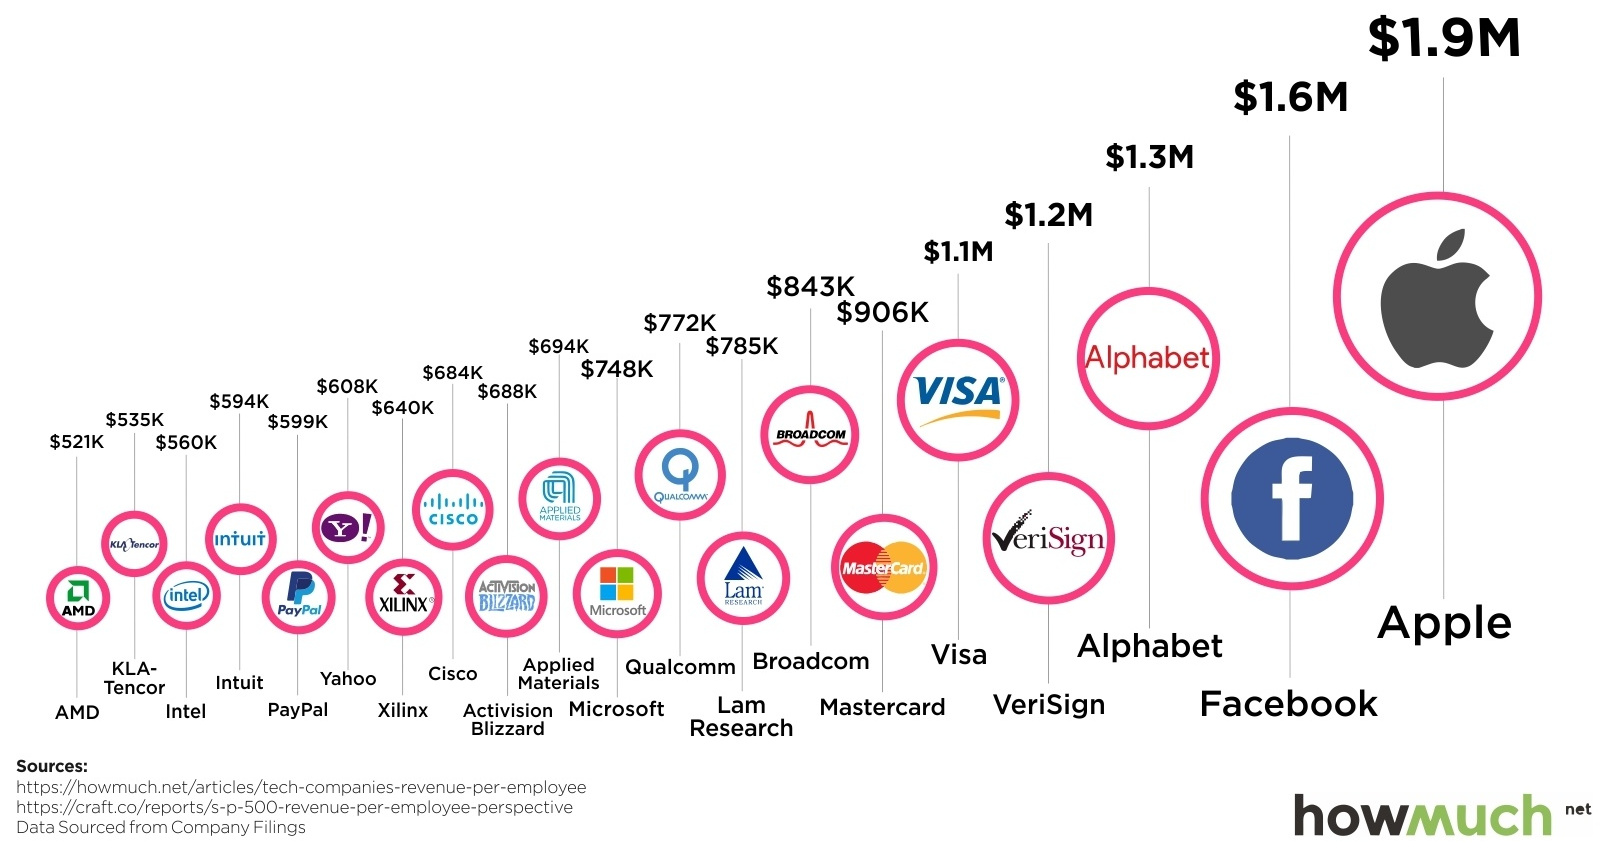
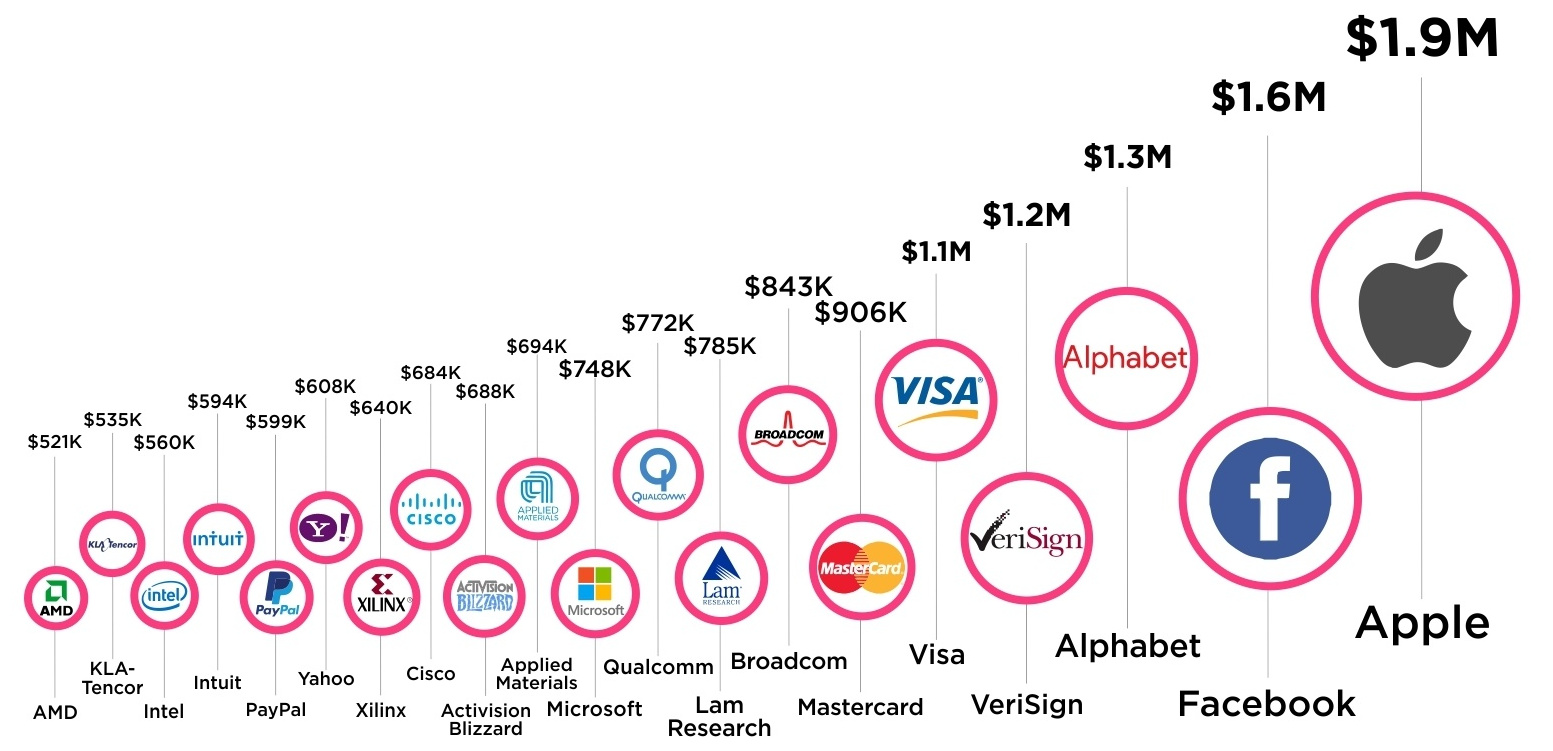
Today’s visualization from cost information site HowMuch.net helps put this all in perspective by showing revenue per employee of some of the world’s largest tech companies that are a part of the S&P 500.
Here’s the data in table form:
| Rank | Company | Revenue per employee |
|---|---|---|
| #1 | Apple | $1,859,000 |
| #2 | $1,621,000 | |
| #3 | Alphabet | $1,253,000 |
| #4 | VeriSign | $1,154,000 |
| #5 | Visa | $1,062,000 |
| #6 | Mastercard | $906,000 |
| #7 | Broadcom | $843,000 |
| #8 | Lam Research | $785,000 |
| #9 | Qualcomm | $772,000 |
| #10 | Microsoft | $748,000 |
| #11 | Applied Materials | $694,000 |
| #12 | Activision Blizzard | $688,000 |
| #13 | Cisco | $684,000 |
| #14 | Xilinx | $640,000 |
| #15 | Yahoo! | $608,000 |
| #16 | PayPal | $599,000 |
| #17 | Intuit | $594,000 |
| #18 | Intel | $560,000 |
| #19 | KLA-Tencor | $535,000 |
| #20 | AMD | $521,000 |
List only based on S&P 500 companies listed in “Technology” category
Facebook, Alphabet, and Visa each bring in over $1 million in revenue per employee – and Apple rakes in nearly $2 million per person.
While these numbers are impressive, not all tech companies on the S&P 500 are masters of scale. In fact, the average tech company brings in closer to $480,000 of revenue per employee.
This amount is comparable to other sectors that make up the S&P 500, like Materials ($600,000 per employee) or Consumer Discretionary ($420,000 per employee).


Technology
Ranked: Semiconductor Companies by Industry Revenue Share
Nvidia is coming for Intel’s crown. Samsung is losing ground. AI is transforming the space. We break down revenue for semiconductor companies.


Semiconductor Companies by Industry Revenue Share
This was originally posted on our Voronoi app. Download the app for free on Apple or Android and discover incredible data-driven charts from a variety of trusted sources.
Did you know that some computer chips are now retailing for the price of a new BMW?
As computers invade nearly every sphere of life, so too have the chips that power them, raising the revenues of the businesses dedicated to designing them.
But how did various chipmakers measure against each other last year?
We rank the biggest semiconductor companies by their percentage share of the industry’s revenues in 2023, using data from Omdia research.
Which Chip Company Made the Most Money in 2023?
Market leader and industry-defining veteran Intel still holds the crown for the most revenue in the sector, crossing $50 billion in 2023, or 10% of the broader industry’s topline.
All is not well at Intel, however, with the company’s stock price down over 20% year-to-date after it revealed billion-dollar losses in its foundry business.
| Rank | Company | 2023 Revenue | % of Industry Revenue |
|---|---|---|---|
| 1 | Intel | $51B | 9.4% |
| 2 | NVIDIA | $49B | 9.0% |
| 3 | Samsung Electronics | $44B | 8.1% |
| 4 | Qualcomm | $31B | 5.7% |
| 5 | Broadcom | $28B | 5.2% |
| 6 | SK Hynix | $24B | 4.4% |
| 7 | AMD | $22B | 4.1% |
| 8 | Apple | $19B | 3.4% |
| 9 | Infineon Tech | $17B | 3.2% |
| 10 | STMicroelectronics | $17B | 3.2% |
| 11 | Texas Instruments | $17B | 3.1% |
| 12 | Micron Technology | $16B | 2.9% |
| 13 | MediaTek | $14B | 2.6% |
| 14 | NXP | $13B | 2.4% |
| 15 | Analog Devices | $12B | 2.2% |
| 16 | Renesas Electronics Corporation | $11B | 1.9% |
| 17 | Sony Semiconductor Solutions Corporation | $10B | 1.9% |
| 18 | Microchip Technology | $8B | 1.5% |
| 19 | Onsemi | $8B | 1.4% |
| 20 | KIOXIA Corporation | $7B | 1.3% |
| N/A | Others | $126B | 23.2% |
| N/A | Total | $545B | 100% |
Note: Figures are rounded. Totals and percentages may not sum to 100.
Meanwhile, Nvidia is very close to overtaking Intel, after declaring $49 billion of topline revenue for 2023. This is more than double its 2022 revenue ($21 billion), increasing its share of industry revenues to 9%.
Nvidia’s meteoric rise has gotten a huge thumbs-up from investors. It became a trillion dollar stock last year, and broke the single-day gain record for market capitalization this year.
Other chipmakers haven’t been as successful. Out of the top 20 semiconductor companies by revenue, 12 did not match their 2022 revenues, including big names like Intel, Samsung, and AMD.
The Many Different Types of Chipmakers
All of these companies may belong to the same industry, but they don’t focus on the same niche.
According to Investopedia, there are four major types of chips, depending on their functionality: microprocessors, memory chips, standard chips, and complex systems on a chip.
Nvidia’s core business was once GPUs for computers (graphics processing units), but in recent years this has drastically shifted towards microprocessors for analytics and AI.
These specialized chips seem to be where the majority of growth is occurring within the sector. For example, companies that are largely in the memory segment—Samsung, SK Hynix, and Micron Technology—saw peak revenues in the mid-2010s.

-

 Real Estate2 weeks ago
Visualizing America’s Shortage of Affordable Homes
-

 Technology1 week ago
Ranked: Semiconductor Companies by Industry Revenue Share
-

 Money1 week ago
Which States Have the Highest Minimum Wage in America?
-

 Real Estate1 week ago
Ranked: The Most Valuable Housing Markets in America
-

 Business2 weeks ago
Charted: Big Four Market Share by S&P 500 Audits
-

 AI2 weeks ago
The Stock Performance of U.S. Chipmakers So Far in 2024
-

 Misc2 weeks ago
Almost Every EV Stock is Down After Q1 2024
-

 Money2 weeks ago
Where Does One U.S. Tax Dollar Go?