Money
Mapping the World’s Wealthiest Cities
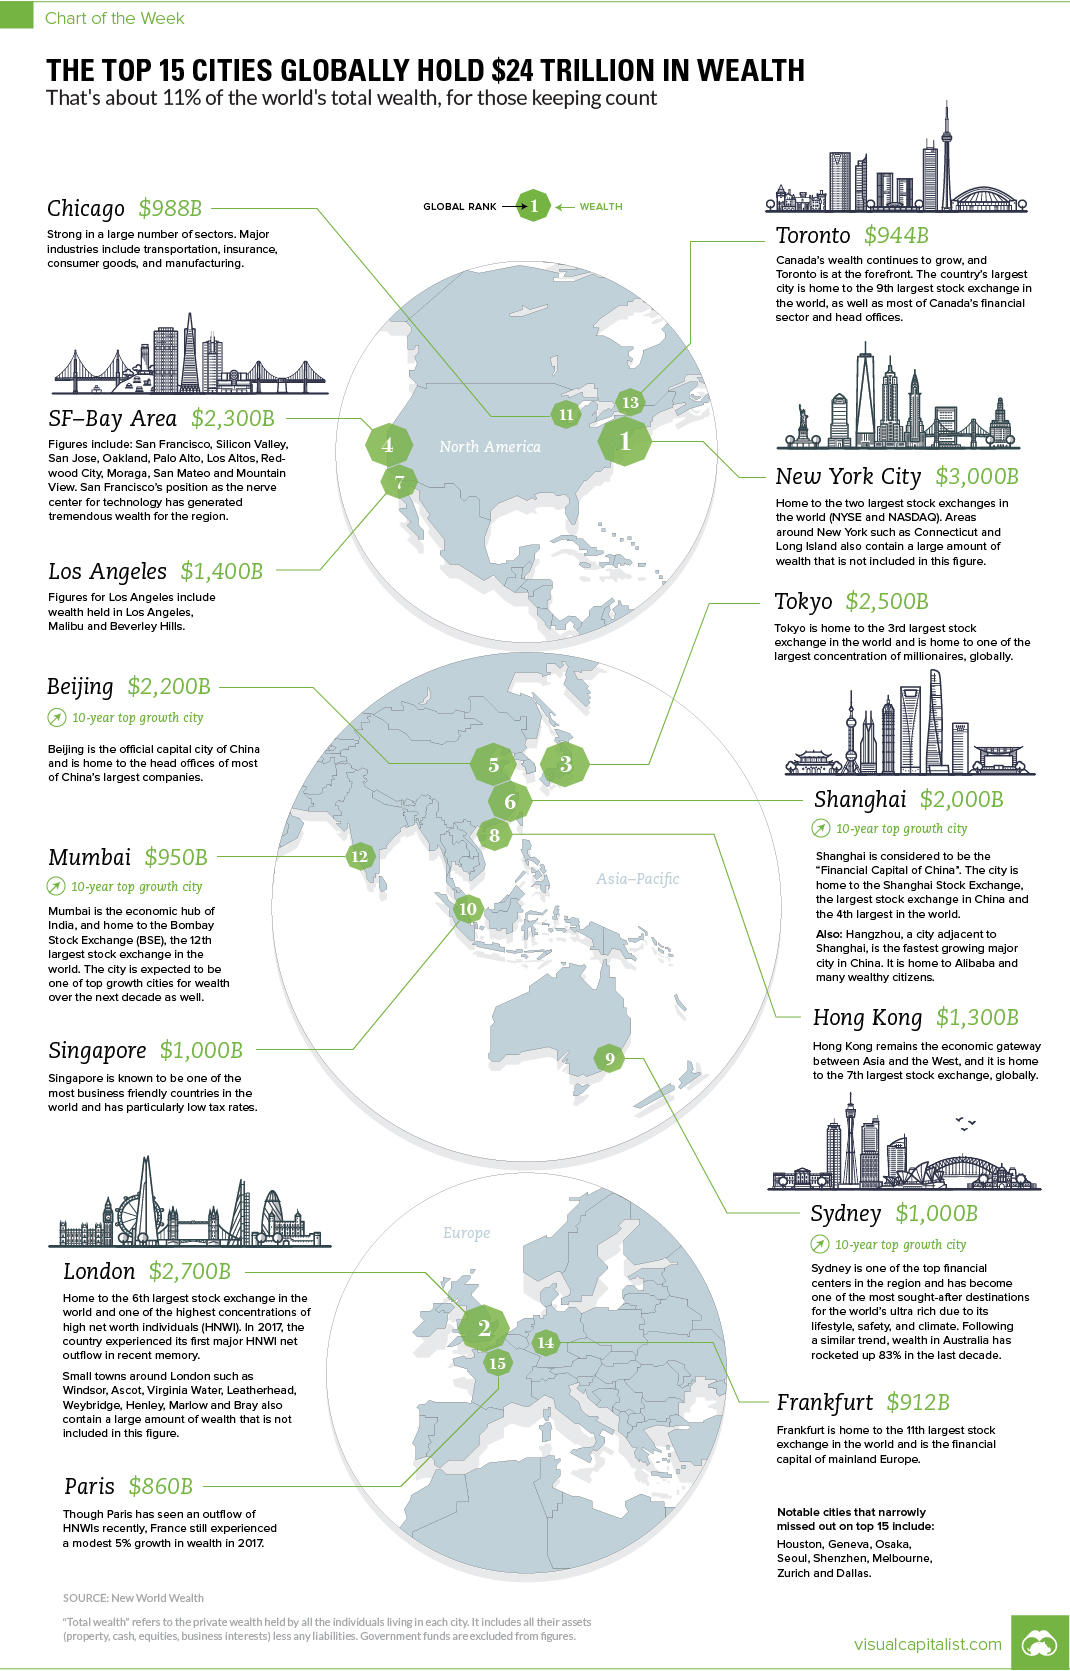
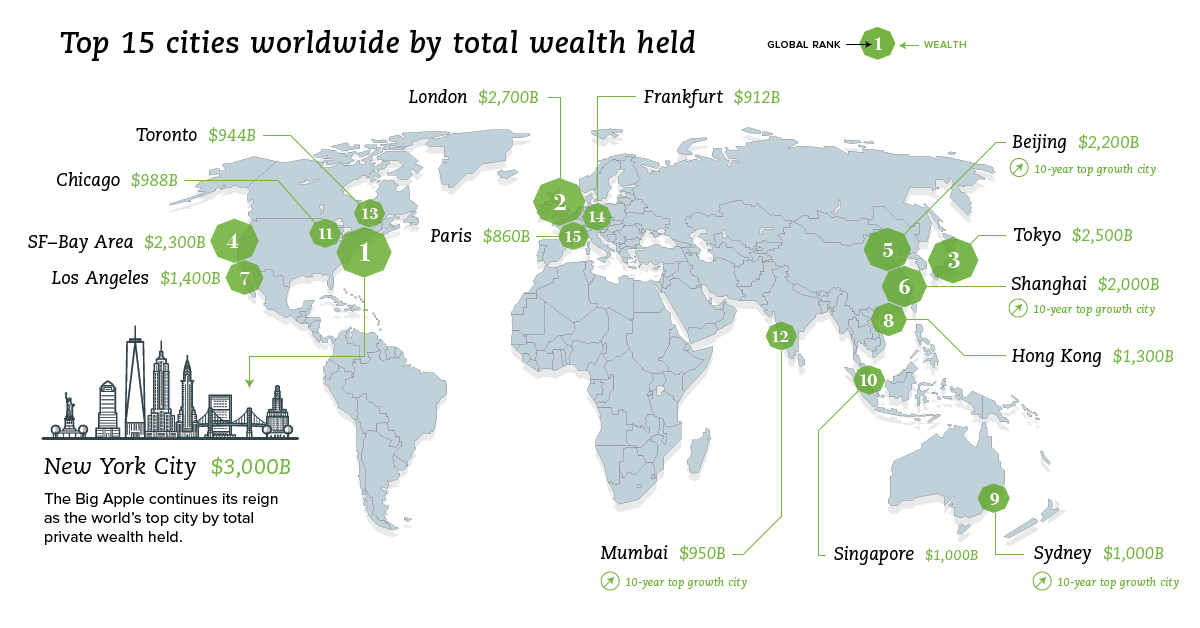
The Top 15 Cities Globally Hold $24 Trillion in Wealth
That’s about 11% of the world’s total private wealth
The Chart of the Week is a weekly Visual Capitalist feature on Fridays.
Which cities are the world’s economic powerhouses, and what portion of global wealth is located in these key urban centers?
Today’s chart pulls information from the latest report from market research firm New World Wealth, which we previously cited weeks ago when we visualized the shift in global wealth over the last decade.
The World’s Wealthiest Cities
The data shown in this chart represents the total amount of private wealth held by all the individuals living in each of these cities.
Figures here include all assets (property, cash, equities, business interests) less any liabilities. Meanwhile, government funds are excluded from these figures.
| Rank | City | Total Wealth |
|---|---|---|
| #1 | New York City | $3.0 trillion |
| #2 | London | $2.7 trillion |
| #3 | Tokyo | $2.5 trillion |
| #4 | San Francisco Bay Area | $2.3 trillion |
| #5 | Beijing | $2.2 trillion |
| #6 | Shanghai | $2.0 trillion |
| #7 | Los Angeles | $1.4 trillion |
| #8 | Hong Kong | $1.3 trillion |
| #9 | Sydney | $1.0 trillion |
| #10 | Singapore | $1.0 trillion |
| #11 | Chicago | $988 billion |
| #12 | Mumbai | $950 billion |
| #13 | Toronto | $944 billion |
| #14 | Frankfurt | $912 billion |
| #15 | Paris | $860 billion |
New World Wealth also mentions that there were eight cities that just missed out on the top 15: Houston, Geneva, Osaka, Seoul, Shenzhen, Melbourne, Zurich and Dallas.
It should also be made clear that wealth is a different measure than Gross Domestic Product (GDP), which is another common metric used to gauge economic power. That said, we do have a list of U.S. cities by GDP size if you’d like to explore the GDP measure on a city level, as well.
Wealth Past and Present
According to the same report, over last 10 years, the cities with the fastest growing rates of wealth were San Francisco, Beijing, Shanghai, Mumbai, and Sydney.
Meanwhile, Mumbai is expected to be the city that will see the highest rate of growth over the next decade.
Interestingly, the report also singles out two major Chinese cities as ones to watch:
Shenzhen: With $770 billion in wealth, this city just misses the Top 15 list. It’s considered the high tech capital of China and is home to the Shenzhen stock exchange (2nd largest in China, and 8th largest in the world). Major smartphone manufacturer Huawei is also based in the city.
Hangzhou: With $425 billion in wealth, this city doesn’t quite measure up to others on the list at first glance. However, it’s actually only a 45 minute train ride away from Shanghai ($2.0 trillion) – and people that work in Shanghai often have homes here as it is considered more scenic. Hangzhou is the fastest growing major city in China (in terms of wealth growth), and ecommerce giant Alibaba notably calls the city its home, as well.


Money
Charted: Who Has Savings in This Economy?
Older, better-educated adults are winning the savings game, reveals a January survey by the National Opinion Research Center at the University of Chicago.


Who Has Savings in This Economy?
This was originally posted on our Voronoi app. Download the app for free on iOS or Android and discover incredible data-driven charts from a variety of trusted sources.
Two full years of inflation have taken their toll on American households. In 2023, the country’s collective credit card debt crossed $1 trillion for the first time. So who is managing to save money in the current economic environment?
We visualize the percentage of respondents to the statement “I have money leftover at the end of the month” categorized by age and education qualifications. Data is sourced from a National Endowment for Financial Education (NEFE) report, published last month.
The survey for NEFE was conducted from January 12-14, 2024, by the National Opinion Research Center at the University of Chicago. It involved 1,222 adults aged 18+ and aimed to be representative of the U.S. population.
Older Americans Save More Than Their Younger Counterparts
General trends from this dataset indicate that as respondents get older, a higher percentage of them are able to save.
| Age | Always/Often | Sometimes | Rarely/Never |
|---|---|---|---|
| 18–29 | 29% | 33% | 38% |
| 30–44 | 36% | 27% | 37% |
| 45–59 | 39% | 23% | 38% |
| Above 60 | 49% | 28% | 23% |
| All Adults | 39% | 33% | 27% |
Note: Percentages are rounded and may not sum to 100.
Perhaps not surprisingly, those aged 60+ are the age group with the highest percentage saying they have leftover money at the end of the month. This age group spent the most time making peak earnings in their careers, are more likely to have investments, and are more likely to have paid off major expenses like a mortgage or raising a family.
The Impact of Higher Education on Earnings and Savings
Based on this survey, higher education dramatically improves one’s ability to save. Shown in the table below, those with a bachelor’s degree or higher are three times more likely to have leftover money than those without a high school diploma.
| Education | Always/Often | Sometimes | Rarely/Never |
|---|---|---|---|
| No HS Diploma | 18% | 26% | 56% |
| HS Diploma | 28% | 33% | 39% |
| Associate Degree | 33% | 31% | 36% |
| Bachelor/Higher Degree | 59% | 21% | 20% |
| All Adults | 39% | 33% | 27% |
Note: Percentages are rounded and may not sum to 100.
As the Bureau of Labor Statistics notes, earnings improve with every level of education completed.
For example, those with a high school diploma made 25% more than those without in 2022. And as the qualifications increase, the effects keep stacking.
Meanwhile, a Federal Reserve study also found that those with more education tended to make financial decisions that contributed to building wealth, of which the first step is to save.

-

 Markets1 week ago
U.S. Debt Interest Payments Reach $1 Trillion
-

 Business2 weeks ago
Charted: Big Four Market Share by S&P 500 Audits
-

 Real Estate2 weeks ago
Ranked: The Most Valuable Housing Markets in America
-

 Money2 weeks ago
Which States Have the Highest Minimum Wage in America?
-

 AI2 weeks ago
Ranked: Semiconductor Companies by Industry Revenue Share
-

 Markets2 weeks ago
Ranked: The World’s Top Flight Routes, by Revenue
-

 Demographics2 weeks ago
Population Projections: The World’s 6 Largest Countries in 2075
-

 Markets2 weeks ago
The Top 10 States by Real GDP Growth in 2023