Mining
Three Major Reasons for Gold in 2016
Three Major Reasons for Gold in 2016
Presented by: Advantage Gold
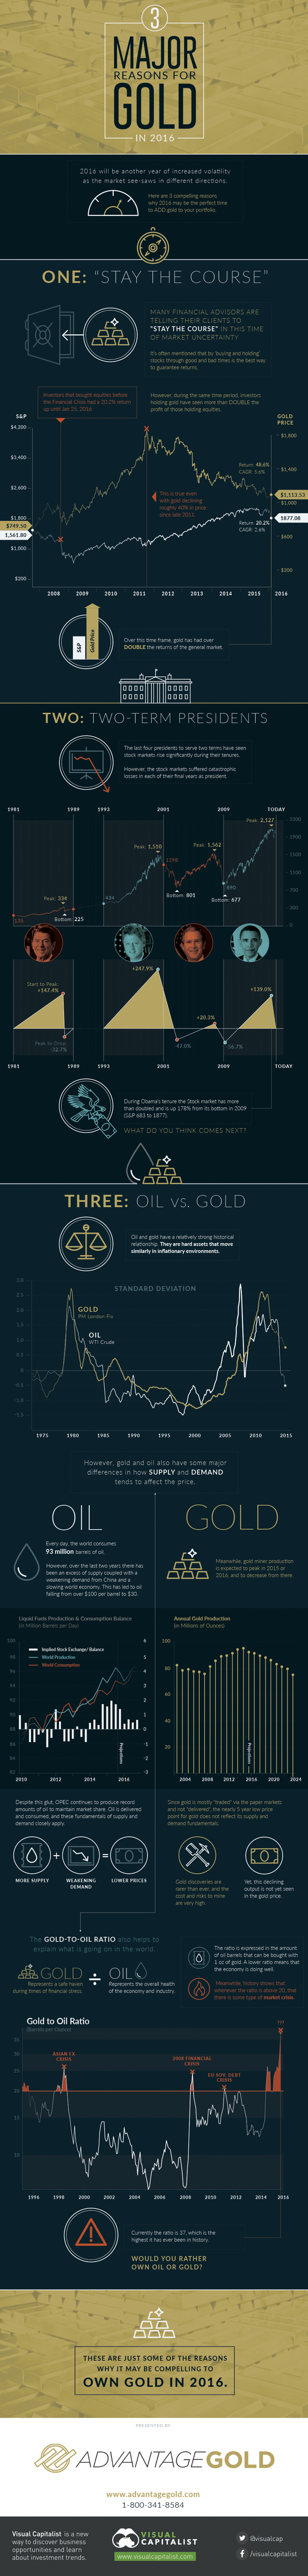
This year looks to be another one of increased volatility as the market see-saws in different directions. Here are three compelling reasons why 2016 may be the perfect time to add gold to your portfolio.
1: “Stay the Course”
Financial experts often mention that “buying and holding” stocks through good and bad times is the best way to guarantee returns.
Investors that bought equities before the Financial Crisis have had a 20.2% return up until January 25, 2016. They “stayed the course” and were rewarded with an eventual return.
However, those that held gold during that same time period until today have had a 48.6% return, which is more than double that of the general market. This is even true with gold declining roughly 40% from its peak since late 2011.
Does it make more sense to “stay the course” in 2016 with stocks, or gold?
2: Two-Term Presidents
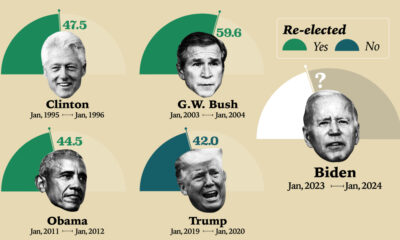
The last four presidents to serve two terms have had stock markets rise significantly during their tenures.
However, the stock markets also suffered catastrophic losses in each of their final years as president.
For example, during George W. Bush’s tenure, the S&P 500 nearly doubled from a bottom of 801 during the Dotcom bust to a peak of 1,562. Then the Financial Crisis hit at the end of Bush’s second term and the market went down to 677 points.
Obama is now in his last year, and the market is up 178% from its bottom in 2009. Will the trend continue?
3: Oil vs. Gold
Oil and gold have a relatively strong historical relationship. They are hard assets that move similarly in inflationary environments.
However, gold and oil also have some major differences in how supply and demand tends to affect the price.
Oil: Every day the world consumes 93 million barrels of oil. However, over the last two years there has been an excess of supply coupled with weakening demand from China and a slowing world economy. This has led to oil falling from over $100 per barrel to $30. Despite this glut, OPEC continues to produce record amounts of oil to maintain market share. Oil is delivered and consumed, and these fundamentals of supply and demand closely apply. More supply + weakening demand = lower prices.
Gold: Meanwhile, gold miner production is expected to peak in 2015 or 2016, and to decrease from there. Since gold is mostly traded via paper markets and not delivered, the nearly five-year low price point for gold may not fully reflect its supply and demand fundamentals. Gold discoveries are rarer than ever, and the cost and risks to mine are very high. Yet, this declining output is not yet seen in the gold price.
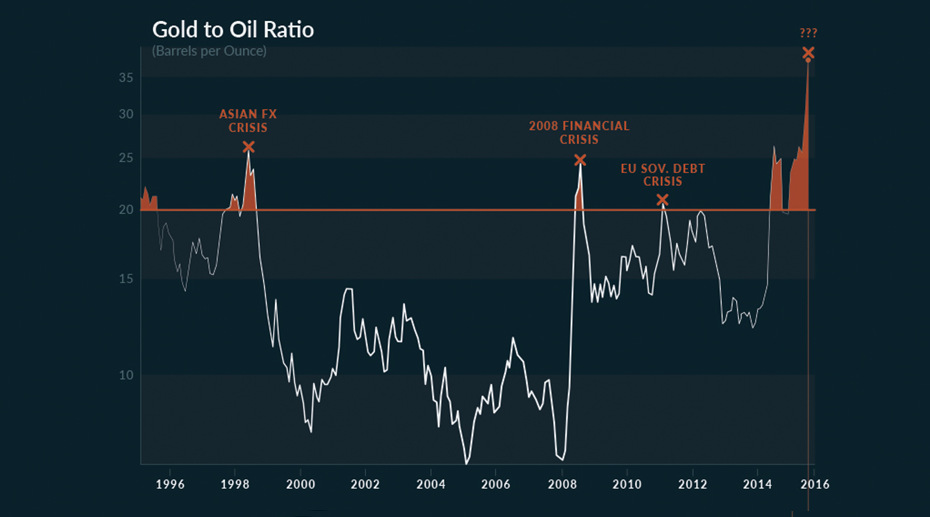
Gold to Oil Ratio
Lastly, the ratio between these two goods helps to explain what is going on in the world. Gold represents a safe haven during times of financial stress, and oil represents the overall health of the economy and industry.
The gold to oil ratio is expressed in the amount of oil barrels that can be bought with 1 oz of gold. A lower ratio means that the economy is doing well. Meanwhile, history shows that whenever the ratio is above 20, there has been some type of market crisis.
Today, this ratio is higher than ever in history at 37.
Would you rather own oil or gold?


Mining
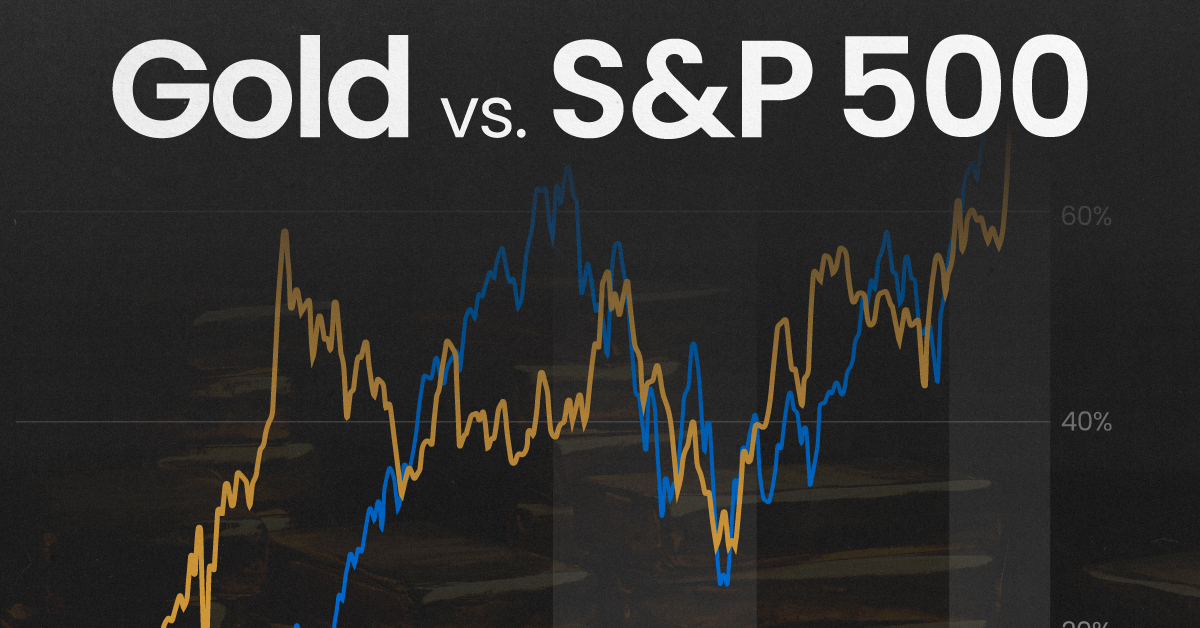
Gold vs. S&P 500: Which Has Grown More Over Five Years?
The price of gold has set record highs in 2024, but how has this precious metal performed relative to the S&P 500?

Gold vs. S&P 500: Which Has Grown More Over Five Years?
This was originally posted on our Voronoi app. Download the app for free on Apple or Android and discover incredible data-driven charts from a variety of trusted sources.
Gold is considered a unique asset due to its enduring value, historical significance, and application in various technologies like computers, spacecraft, and communications equipment.
Commonly regarded as a “safe haven asset”, gold is something investors typically buy to protect themselves during periods of global uncertainty and economic decline.
It is for this reason that gold has performed rather strongly in recent years, and especially in 2024. Persistent inflation combined with multiple wars has driven up demand for gold, helping it set a new all-time high of over $2,400 per ounce.
To put this into perspective, we visualized the performance of gold alongside the S&P 500. See the table below for performance figures as of April 12, 2024.
| Asset/Index | 1 Yr (%) | 5 Yr (%) |
|---|---|---|
| 🏆 Gold | +16.35 | +81.65 |
| 💼 S&P 500 | +25.21 | +76.22 |
Over the five-year period, gold has climbed an impressive 81.65%, outpacing even the S&P 500.
Get Your Gold at Costco
Perhaps a sign of how high the demand for gold is becoming, wholesale giant Costco is reportedly selling up to $200 million worth of gold bars every month in the United States. The year prior, sales only amounted to $100 million per quarter.
Consumers aren’t the only ones buying gold, either. Central banks around the world have been accumulating gold in very large quantities, likely as a hedge against inflation.
According to the World Gold Council, these institutions bought 1,136 metric tons in 2022, marking the highest level since 1950. Figures for 2023 came in at 1,037 metric tons.
See More Graphics on Gold
If you’re fascinated by gold, be sure to check out more Visual Capitalist content including 200 Years of Global Gold Production, by Country or Ranked: The Largest Gold Reserves by Country.

-

 Mining2 weeks ago
Charted: The Value Gap Between the Gold Price and Gold Miners
-

 Real Estate1 week ago
Ranked: The Most Valuable Housing Markets in America
-

 Business1 week ago
Charted: Big Four Market Share by S&P 500 Audits
-

 AI1 week ago
The Stock Performance of U.S. Chipmakers So Far in 2024
-

 Misc1 week ago
Almost Every EV Stock is Down After Q1 2024
-

 Money2 weeks ago
Where Does One U.S. Tax Dollar Go?
-

 Green2 weeks ago
Ranked: Top Countries by Total Forest Loss Since 2001
-

 Real Estate2 weeks ago
Visualizing America’s Shortage of Affordable Homes