Personal Finance
Then vs. Now: What Does $1 Buy You?
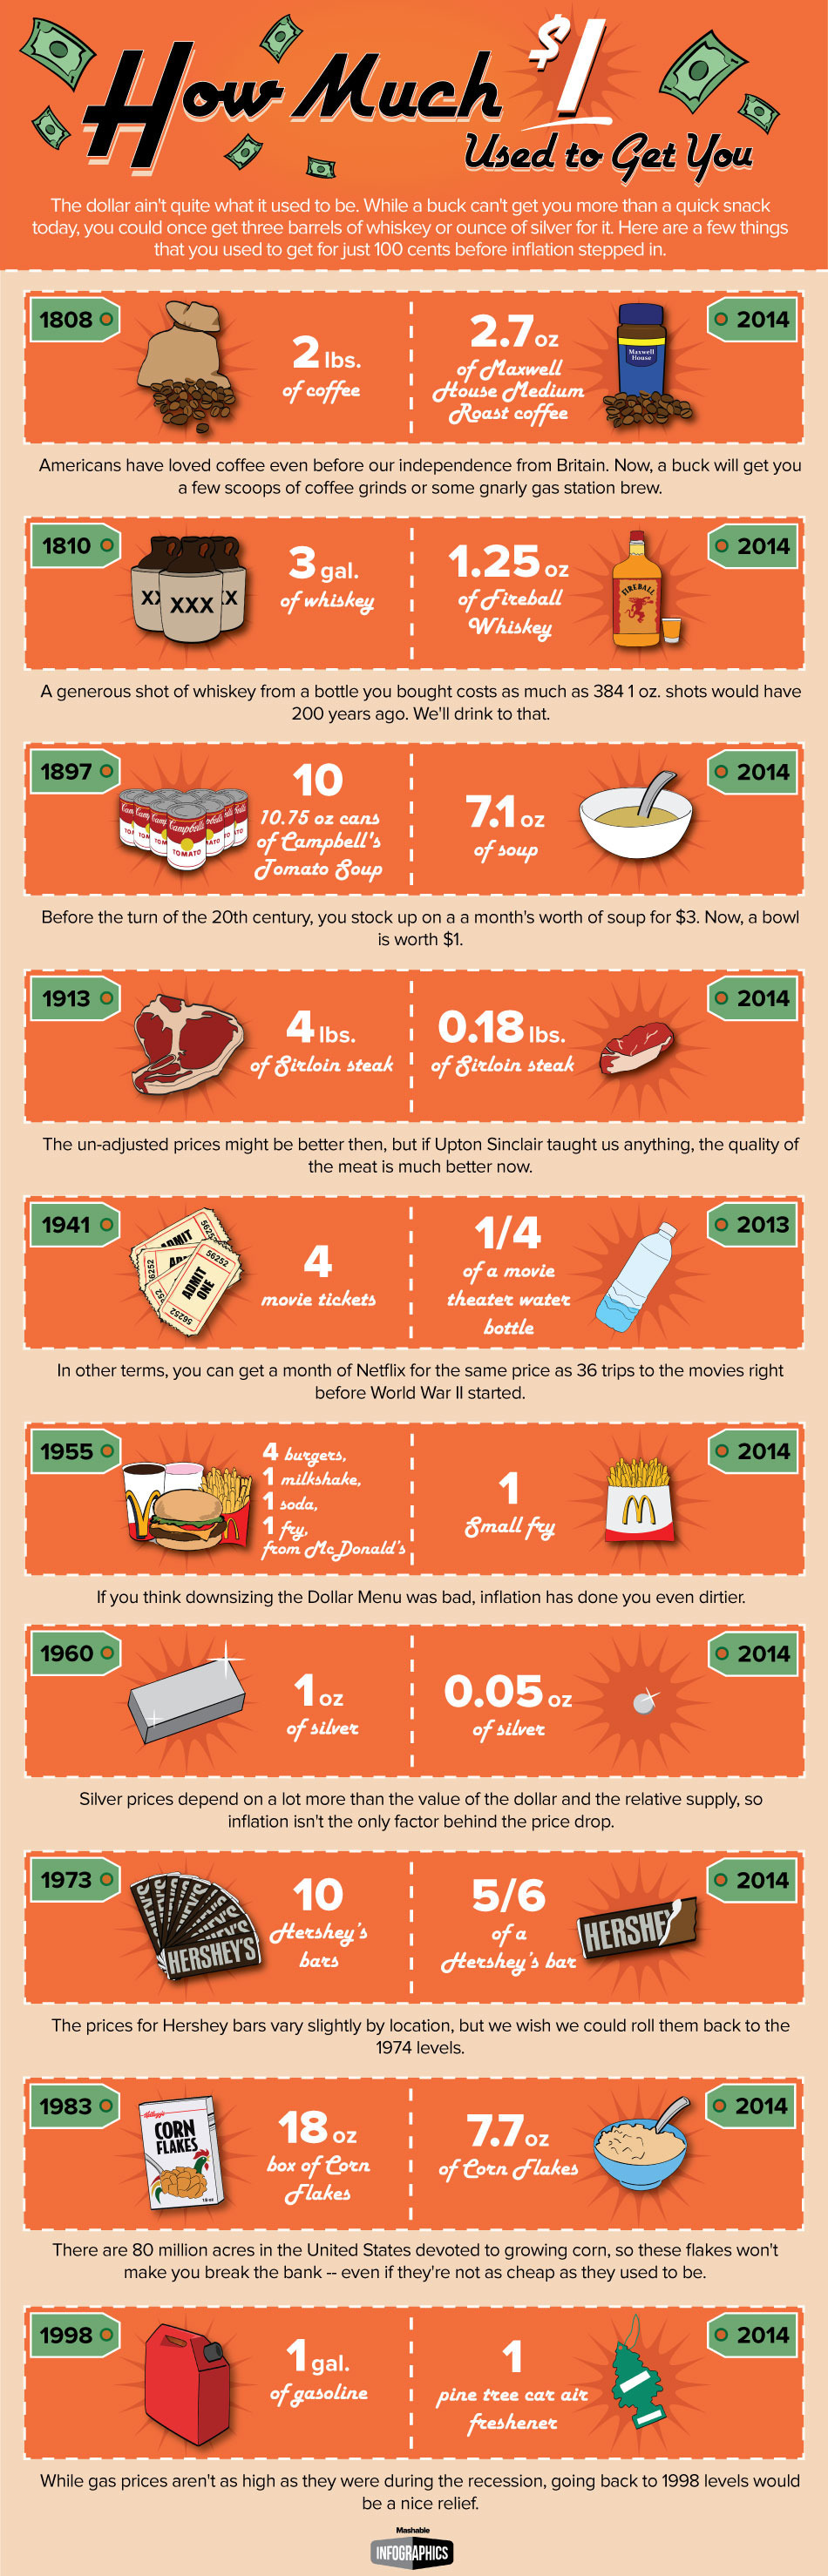
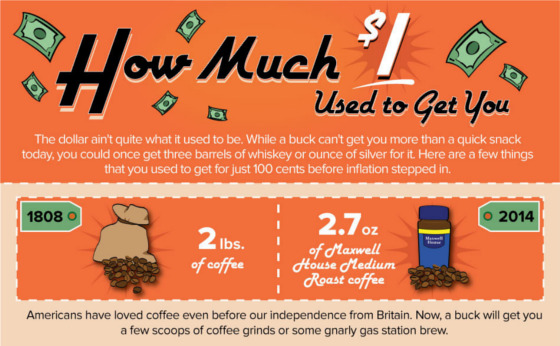
Then vs. Now: What does $1 Buy You?
Keynesians and Austrian economists will disagree on many points on inflation. However, a conclusion which is universal is the great power of inflation over time.
While the measurement of CPI may be up to debate, the cold hard facts don’t lie. In 1960, one dollar bought an ounce of silver. Today, it buys closer to 1/20 of an ounce. If you go all the way back to 1810, one dollar bought 3 gallons of whiskey. In the bar today, it buys just 1.25 oz of Fireball, which isn’t exactly the high-end stuff.
You don’t have to go back very far to see the effects of inflation. Just in 1998, a gallon of gasoline was only $1. Now, all you have to do is look at the nearest pump.
Original graphic from: Mashable


Personal Finance
Chart: The Declining Value of the U.S. Federal Minimum Wage
This graphic compares the nominal vs. inflation-adjusted value of the U.S. minimum wage, from 1940 to 2023.


The Declining Value of the U.S. Federal Minimum Wage
This was originally posted on our Voronoi app. Download the app for free on iOS or Android and discover incredible data-driven charts from a variety of trusted sources.
This graphic illustrates the history of the U.S. federal minimum wage using data compiled by Statista, in both nominal and real (inflation-adjusted) terms. The federal minimum wage was raised to $7.25 per hour in July 2009, where it has remained ever since.
Nominal vs. Real Value
The data we used to create this graphic can be found in the table below.
| Year | Nominal value ($/hour) | Real value ($/hour) |
|---|---|---|
| 1940 | 0.3 | 6.5 |
| 1945 | 0.4 | 6.82 |
| 1950 | 0.75 | 9.64 |
| 1955 | 0.75 | 8.52 |
| 1960 | 1 | 10.28 |
| 1965 | 1.25 | 12.08 |
| 1970 | 1.6 | 12.61 |
| 1975 | 2.1 | 12.04 |
| 1980 | 3.1 | 11.61 |
| 1985 | 3.35 | 9.51 |
| 1990 | 3.8 | 8.94 |
| 1995 | 4.25 | 8.49 |
| 2000 | 5.15 | 9.12 |
| 2005 | 5.15 | 8.03 |
| 2010 | 7.25 | 10.09 |
| 2015 | 7.25 | 9.3 |
| 2018 | 7.25 | 8.78 |
| 2019 | 7.25 | 8.61 |
| 2020 | 7.25 | 8.58 |
| 2021 | 7.25 | 8.24 |
| 2022 | 7.25 | 7.61 |
| 2023 | 7.25 | 7.25 |
What our graphic shows is how inflation has eroded the real value of the U.S. minimum wage over time, despite nominal increases.
For instance, consider the year 1960, when the federal minimum wage was $1 per hour. After accounting for inflation, this would be worth around $10.28 today!
The two lines converge at 2023 because the nominal and real value are identical in present day terms.
Many States Have Their Own Minimum Wage
According to the National Conference of State Legislatures (NCSL), 30 states and Washington, D.C. have implemented a minimum wage that is higher than $7.25.
The following states have adopted the federal minimum: Georgia, Idaho, Indiana, Iowa, Kansas, Kentucky, New Hampshire, North Carolina, North Dakota, Oklahoma, Pennsylvania, Texas, Utah, Wisconsin, and Wyoming.
Meanwhile, the states of Alabama, Louisiana, Mississippi, South Carolina, and Tennessee have no wage minimums, but have to follow the federal minimum.
How Does the U.S. Minimum Wage Rank Globally?
If you found this topic interesting, check out Mapped: Minimum Wage Around the World to see which countries have the highest minimum wage in monthly terms, as of January 2023.

-

 Real Estate2 weeks ago
Visualizing America’s Shortage of Affordable Homes
-

 Technology1 week ago
Ranked: Semiconductor Companies by Industry Revenue Share
-

 Money1 week ago
Which States Have the Highest Minimum Wage in America?
-

 Real Estate1 week ago
Ranked: The Most Valuable Housing Markets in America
-

 Business2 weeks ago
Charted: Big Four Market Share by S&P 500 Audits
-

 AI2 weeks ago
The Stock Performance of U.S. Chipmakers So Far in 2024
-

 Misc2 weeks ago
Almost Every EV Stock is Down After Q1 2024
-

 Money2 weeks ago
Where Does One U.S. Tax Dollar Go?