Markets
The World’s 20 Most Profitable Companies
The World’s 20 Most Profitable Companies
The biggest chunk of the earnings pie is increasingly split by fewer and fewer companies.
In the U.S. for example, about 50% of all profit generated by public companies goes to just 30 companies — back in 1975, it took 109 companies to accomplish the same feat:
| Year | Number of Firms Generating 50% of Earnings | Total Public Companies (U.S.) | Portion (%) |
|---|---|---|---|
| 1975 | 109 | 4,819 | 2.2% |
| 2015 | 30 | 3,766 | 0.8% |
This power-law dynamic also manifests itself at a global level — and perhaps it’s little surprise that the world’s most profitable companies generate mind-bending returns that would make any accountant blush.
Which Company Makes the Most Per Day?
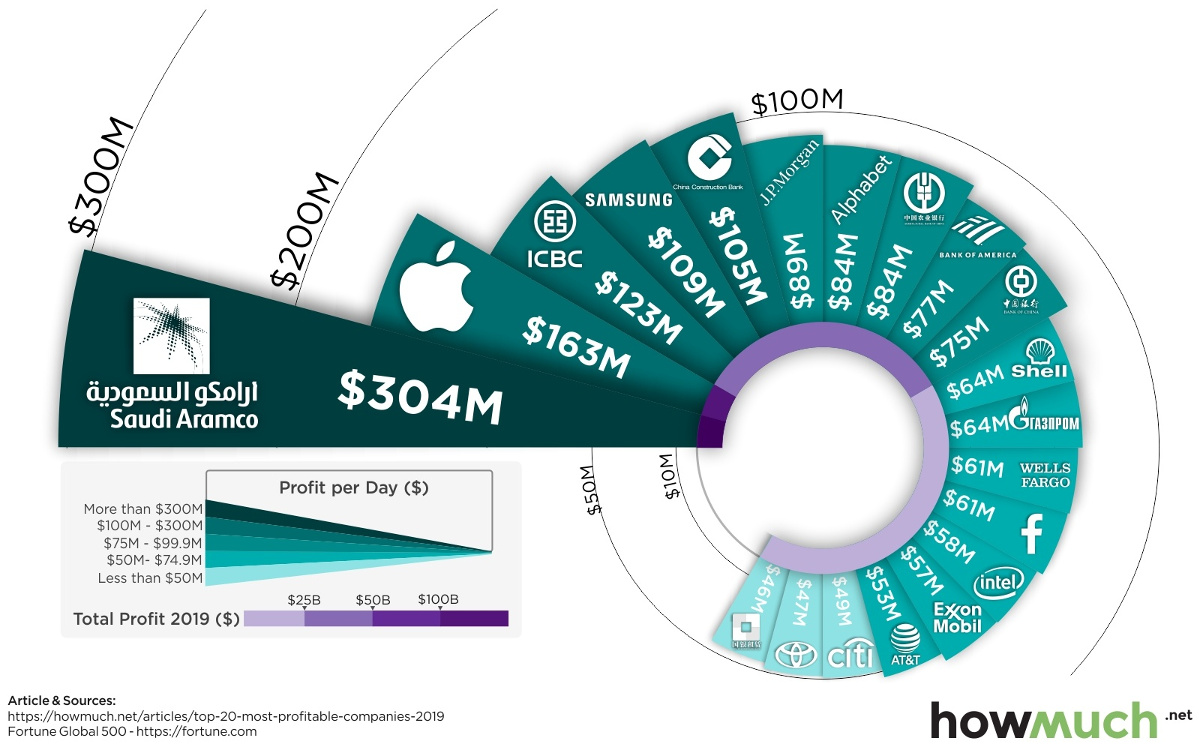
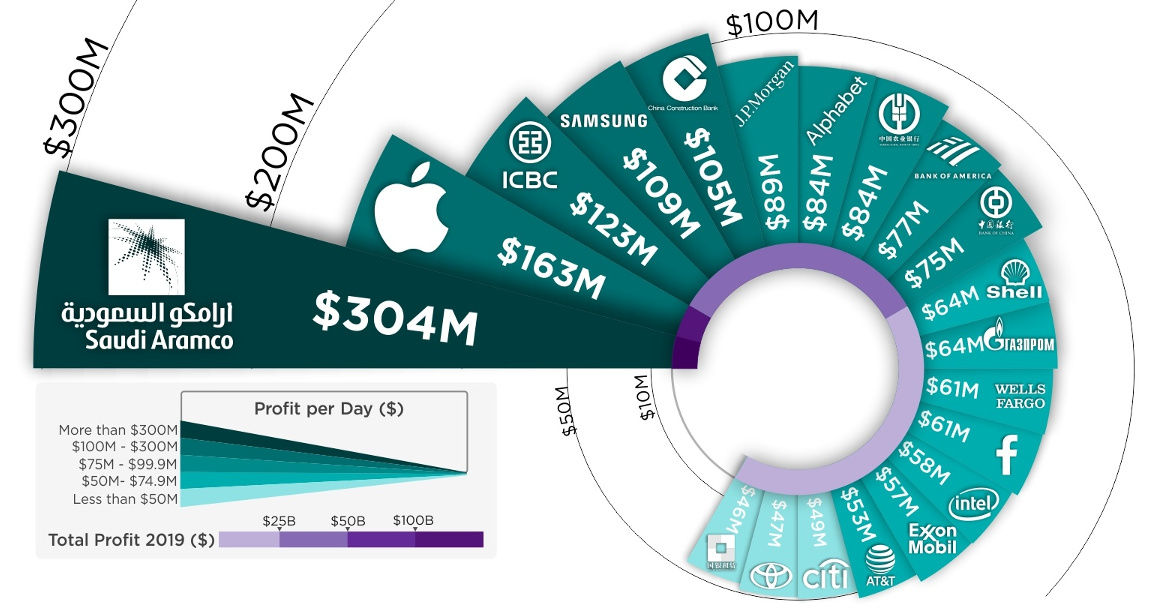
Today’s infographic comes to us from HowMuch.net, and it uses data from Fortune to illustrate how much profit top global companies actually rake in on a daily basis.
The 20 most profitable companies in the world are listed below in order, and we’ve also broken the same data down per second:
| Rank | Company | Country | Profit per Day | Profit Per Second |
|---|---|---|---|---|
| #1 | Saudi Aramco | 🇸🇦 Saudi Arabia | $304,039,726 | $3,519 |
| #2 | Apple | 🇺🇸 United States | $163,098,630 | $1,888 |
| #3 | Industrial & Commercial Bank of China | 🇨🇳 China | $123,293,973 | $1,427 |
| #4 | Samsung Electronics | 🇰🇷 South Korea | $109,301,918 | $1,265 |
| #5 | China Construction Bank | 🇨🇳 China | $105,475,068 | $1,221 |
| #6 | JPMorgan Chase & Co. | 🇺🇸 United States | $88,969,863 | $1,030 |
| #7 | Alphabet | 🇺🇸 United States | $84,208,219 | $975 |
| #8 | Agricultural Bank of China | 🇨🇳 China | $83,990,411 | $972 |
| #9 | Bank of America Corp. | 🇺🇸 United States | $77,115,068 | $893 |
| #10 | Bank of China | 🇨🇳 China | $74,589,589 | $863 |
| #11 | Royal Dutch Shell | 🇬🇧 🇳🇱 UK/Netherlands | $63,978,082 | $740 |
| #12 | Gazprom | 🇷🇺 Russia | $63,559,178 | $736 |
| #13 | Wells Fargo | 🇺🇸 United States | $61,350,685 | $710 |
| #14 | 🇺🇸 United States | $60,580,822 | $701 | |
| #15 | Intel | 🇺🇸 United States | $57,679,452 | $668 |
| #16 | Exxon Mobil | 🇺🇸 United States | $57,095,890 | $661 |
| #17 | AT&T | 🇺🇸 United States | $53,068,493 | $614 |
| #18 | Citigroup | 🇺🇸 United States | $49,438,356 | $572 |
| #19 | Toyota Motor | 🇯🇵 Japan | $46,526,027 | $538 |
| #20 | China Development Bank | 🇨🇳 China | $45,874,795 | $531 |
The Saudi Arabian Oil Company, known to most as Saudi Aramco, is by far the world’s most profitable company, raking in a stunning $304 million of profits every day. When translated to a more micro scale, that works out to $3,519 per second.
You’ve likely seen Saudi Aramco in the news lately, though for other reasons.
The giant state-owned company has been rearing to go public at an aggressive $2 trillion valuation, but it’s since delayed that IPO multiple times, most recently stating the listing will take place in December 2019 or January 2020. Company-owned refineries were also the subject of drone attacks last month, which took offline 5.7 million bpd of oil production temporarily.
Despite these challenges, Saudi Aramco still stands pretty tall — after all, such blows are softened when you churn out the same amount of profit as Apple, Alphabet, and Facebook combined.
Numbers on an Annual Basis
Bringing in over $300 million per day of profit is pretty hard to comprehend, but the numbers are even more unfathomable when they are annualized.
| Rank | Company | Country | Profit |
|---|---|---|---|
| #1 | Saudi Aramco | 🇸🇦 Saudi Arabia | $110,974,500,000 |
| #2 | Apple | 🇺🇸 United States | $59,531,000,000 |
| #3 | Industrial & Commercial Bank of China | 🇨🇳 China | $45,002,300,000 |
| #4 | Samsung Electronics | 🇰🇷 South Korea | $39,895,200,000 |
| #5 | China Construction Bank | 🇨🇳 China | $38,498,400,000 |
| #6 | JPMorgan Chase & Co. | 🇺🇸 United States | $32,474,000,000 |
| #7 | Alphabet | 🇺🇸 United States | $30,736,000,000 |
| #8 | Agricultural Bank of China | 🇨🇳 China | $30,656,500,000 |
| #9 | Bank of America Corp. | 🇺🇸 United States | $28,147,000,000 |
| #10 | Bank of China | 🇨🇳 China | $27,225,200,000 |
| #11 | Royal Dutch Shell | 🇬🇧 🇳🇱 UK/Netherlands | $23,352,000,000 |
| #12 | Gazprom | 🇷🇺 Russia | $23,199,100,000 |
| #13 | Wells Fargo | 🇺🇸 United States | $22,393,000,000 |
| #14 | 🇺🇸 United States | $22,112,000,000 | |
| #15 | Intel | 🇺🇸 United States | $21,053,000,000 |
| #16 | Exxon Mobil | 🇺🇸 United States | $20,840,000,000 |
| #17 | AT&T | 🇺🇸 United States | $19,370,000,000 |
| #18 | Citigroup | 🇺🇸 United States | $18,045,000,000 |
| #19 | Toyota Motor | 🇯🇵 Japan | $16,982,000,000 |
| #20 | China Development Bank | 🇨🇳 China | $16,744,300,000 |
On an annual basis, Saudi Aramco is raking in $111 billion of profit per year, and that’s with oil prices sitting in the $50-$70 per barrel range.
To put this number in perspective, take a look at Chevron. The American oil giant is one of the 20 biggest companies on the S&P 500, but it generated just $15 billion in profit in 2018 and currently sits at a $221 billion market capitalization.
That puts Chevron’s profits at roughly 10% of Aramco’s — and if Aramco does IPO at a $2 trillion valuation, that would put Chevron at roughly 10% of its market cap, as well.


Markets
U.S. Debt Interest Payments Reach $1 Trillion
U.S. debt interest payments have surged past the $1 trillion dollar mark, amid high interest rates and an ever-expanding debt burden.


U.S. Debt Interest Payments Reach $1 Trillion
This was originally posted on our Voronoi app. Download the app for free on iOS or Android and discover incredible data-driven charts from a variety of trusted sources.
The cost of paying for America’s national debt crossed the $1 trillion dollar mark in 2023, driven by high interest rates and a record $34 trillion mountain of debt.
Over the last decade, U.S. debt interest payments have more than doubled amid vast government spending during the pandemic crisis. As debt payments continue to soar, the Congressional Budget Office (CBO) reported that debt servicing costs surpassed defense spending for the first time ever this year.
This graphic shows the sharp rise in U.S. debt payments, based on data from the Federal Reserve.
A $1 Trillion Interest Bill, and Growing
Below, we show how U.S. debt interest payments have risen at a faster pace than at another time in modern history:
| Date | Interest Payments | U.S. National Debt |
|---|---|---|
| 2023 | $1.0T | $34.0T |
| 2022 | $830B | $31.4T |
| 2021 | $612B | $29.6T |
| 2020 | $518B | $27.7T |
| 2019 | $564B | $23.2T |
| 2018 | $571B | $22.0T |
| 2017 | $493B | $20.5T |
| 2016 | $460B | $20.0T |
| 2015 | $435B | $18.9T |
| 2014 | $442B | $18.1T |
| 2013 | $425B | $17.2T |
| 2012 | $417B | $16.4T |
| 2011 | $433B | $15.2T |
| 2010 | $400B | $14.0T |
| 2009 | $354B | $12.3T |
| 2008 | $380B | $10.7T |
| 2007 | $414B | $9.2T |
| 2006 | $387B | $8.7T |
| 2005 | $355B | $8.2T |
| 2004 | $318B | $7.6T |
| 2003 | $294B | $7.0T |
| 2002 | $298B | $6.4T |
| 2001 | $318B | $5.9T |
| 2000 | $353B | $5.7T |
| 1999 | $353B | $5.8T |
| 1998 | $360B | $5.6T |
| 1997 | $368B | $5.5T |
| 1996 | $362B | $5.3T |
| 1995 | $357B | $5.0T |
| 1994 | $334B | $4.8T |
| 1993 | $311B | $4.5T |
| 1992 | $306B | $4.2T |
| 1991 | $308B | $3.8T |
| 1990 | $298B | $3.4T |
| 1989 | $275B | $3.0T |
| 1988 | $254B | $2.7T |
| 1987 | $240B | $2.4T |
| 1986 | $225B | $2.2T |
| 1985 | $219B | $1.9T |
| 1984 | $205B | $1.7T |
| 1983 | $176B | $1.4T |
| 1982 | $157B | $1.2T |
| 1981 | $142B | $1.0T |
| 1980 | $113B | $930.2B |
| 1979 | $96B | $845.1B |
| 1978 | $84B | $789.2B |
| 1977 | $69B | $718.9B |
| 1976 | $61B | $653.5B |
| 1975 | $55B | $576.6B |
| 1974 | $50B | $492.7B |
| 1973 | $45B | $469.1B |
| 1972 | $39B | $448.5B |
| 1971 | $36B | $424.1B |
| 1970 | $35B | $389.2B |
| 1969 | $30B | $368.2B |
| 1968 | $25B | $358.0B |
| 1967 | $23B | $344.7B |
| 1966 | $21B | $329.3B |
Interest payments represent seasonally adjusted annual rate at the end of Q4.
At current rates, the U.S. national debt is growing by a remarkable $1 trillion about every 100 days, equal to roughly $3.6 trillion per year.
As the national debt has ballooned, debt payments even exceeded Medicaid outlays in 2023—one of the government’s largest expenditures. On average, the U.S. spent more than $2 billion per day on interest costs last year. Going further, the U.S. government is projected to spend a historic $12.4 trillion on interest payments over the next decade, averaging about $37,100 per American.
Exacerbating matters is that the U.S. is running a steep deficit, which stood at $1.1 trillion for the first six months of fiscal 2024. This has accelerated due to the 43% increase in debt servicing costs along with a $31 billion dollar increase in defense spending from a year earlier. Additionally, a $30 billion increase in funding for the Federal Deposit Insurance Corporation in light of the regional banking crisis last year was a major contributor to the deficit increase.
Overall, the CBO forecasts that roughly 75% of the federal deficit’s increase will be due to interest costs by 2034.

-

 Maps1 week ago
The Largest Earthquakes in the New York Area (1970-2024)
-

 Money2 weeks ago
Where Does One U.S. Tax Dollar Go?
-

 Automotive2 weeks ago
Almost Every EV Stock is Down After Q1 2024
-

 AI2 weeks ago
The Stock Performance of U.S. Chipmakers So Far in 2024
-

 Markets2 weeks ago
Charted: Big Four Market Share by S&P 500 Audits
-

 Real Estate2 weeks ago
Ranked: The Most Valuable Housing Markets in America
-

 Money2 weeks ago
Which States Have the Highest Minimum Wage in America?
-

 AI2 weeks ago
Ranked: Semiconductor Companies by Industry Revenue Share