Politics
The Polarization of Politics in America
Modern day media has reared its ugly head to make American politics more divisive than ever before. On the one hand, independent media has a more prominent presence which leads to new angles and ideas for those who actively seek them. The flipside is that the internet world is built to be an echo chamber of cognitive bias. Recent studies have shown that our pre-conceptions are not challenged on the web – rather, they get reinforced.
Research from The Pew Research Center confirms that there is growing polarization of politics in the United States, with consensus opinions on both the left and right spreading further apart.
All one has to do to seek proof of this? Take a look at the current outliers in the field of candidates that have announced their US presidential bids: a self-proclaimed democratic socialist, a libertarian-leaning Paul, and a (very) outspoken and often controversial real estate magnate confirm this to be true.
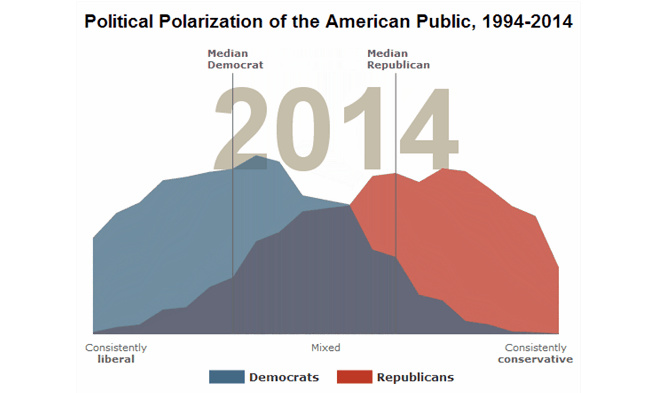
As seen in the above animation, the share of Americans who express a consistently liberal or conservative views have doubled over the past two decades from 10% to 21%. The median positions, which used to overlap relatively closely, have spread much further apart such that the “typical” Republican is more conservative than 94% of Democrats. Two decades ago, this number was only 70%.
Further, there is more hate and blame being passed around these days:
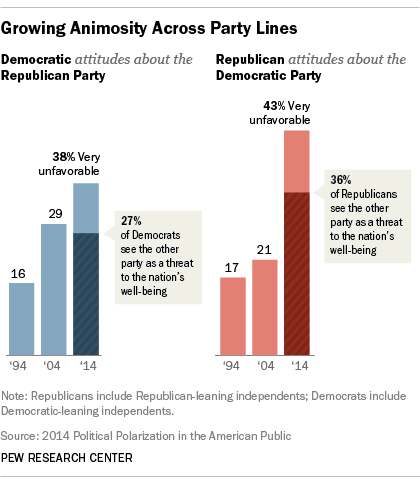
It is now true that 43% of Republicans have “very unfavorable” attitudes about the Democratic Party, and 36% of Republicans even go so far as to say that the blue party is a threat to the nation’s well-being. The feelings are mutual on the other side of the aisle as well, with 38% of Democrats having “very unfavorable” attitudes towards Republicans. This animosity of people surveyed has more than doubled since 1994.
The most ideologically polarized Americans are those that are more engaged in the political process:
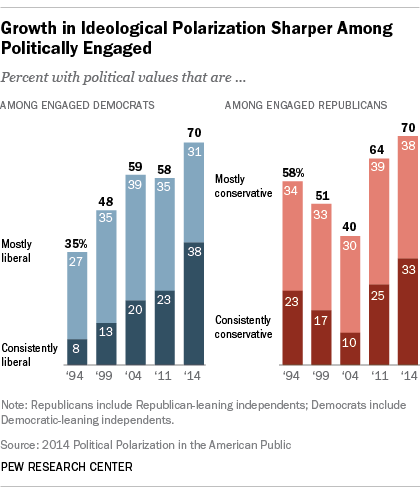
Those that were “consistently” or “mostly” liberal or conservative in their views tended to be those that also considered themselves to be politically engaged.
While the polarization of politics in America seems greater than before, the good news is that the addition of people like Donald Trump, Rand Paul, and Bernie Sanders to the conversation may help for an escape from the usual carefully-refined rhetoric. Getting politicians outside of their comfort zones is a small win for everyone, and it will at least provide for new ideas along with some popcorn munching styled entertainment.
Original graphics by: Pew Research


Economy
The Bloc Effect: International Trade with Geopolitical Allies on the Rise
Rising geopolitical tensions are shaping the future of international trade, but what is the effect on trading among G7 and BRICS countries?


The Bloc Effect: International Trade with Allies on the Rise
International trade has become increasingly fragmented over the last five years as countries have shifted to trading more with their geopolitical allies.
This graphic from The Hinrich Foundation, the first in a three-part series covering the future of trade, provides visual context to the growing divide in trade in G7 and pre-expansion BRICS countries, which are used as proxies for geopolitical blocs.
Trade Shifts in G7 and BRICS Countries
This analysis uses IMF data to examine differences in shares of exports within and between trading blocs from 2018 to 2023. For example, we looked at the percentage of China’s exports with other BRICS members as well as with G7 members to see how these proportions shifted in percentage points (pp) over time.
Countries traded nearly $270 billion more with allies in 2023 compared to 2018. This shift came at the expense of trade with rival blocs, which saw a decline of $314 billion.
Country Change in Exports Within Bloc (pp) Change in Exports With Other Bloc (pp)
🇮🇳 India 0.0 3.9
🇷🇺 Russia 0.7 -3.8
🇮🇹 Italy 0.8 -0.7
🇨🇦 Canada 0.9 -0.7
🇫🇷 France 1.0 -1.1
🇪🇺 EU 1.1 -1.5
🇩🇪 Germany 1.4 -2.1
🇿🇦 South Africa 1.5 1.5
🇺🇸 U.S. 1.6 -0.4
🇯🇵 Japan 2.0 -1.7
🇨🇳 China 2.1 -5.2
🇧🇷 Brazil 3.7 -3.3
🇬🇧 UK 10.2 0.5
All shifts reported are in percentage points. For example, the EU saw its share of exports to G7 countries rise from 74.3% in 2018 to 75.4% in 2023, which equates to a 1.1 percentage point increase.
The UK saw the largest uptick in trading with other countries within the G7 (+10.2 percentage points), namely the EU, as the post-Brexit trade slump to the region recovered.
Meanwhile, the U.S.-China trade dispute caused China’s share of exports to the G7 to fall by 5.2 percentage points from 2018 to 2023, the largest decline in our sample set. In fact, partly as a result of the conflict, the U.S. has by far the highest number of harmful tariffs in place.
The Russia-Ukraine War and ensuing sanctions by the West contributed to Russia’s share of exports to the G7 falling by 3.8 percentage points over the same timeframe.
India, South Africa, and the UK bucked the trend and continued to witness advances in exports with the opposing bloc.
Average Trade Shifts of G7 and BRICS Blocs
Though results varied significantly on a country-by-country basis, the broader trend towards favoring geopolitical allies in international trade is clear.
Bloc Change in Exports Within Bloc (pp) Change in Exports With Other Bloc (pp)
Average 2.1 -1.1
BRICS 1.6 -1.4
G7 incl. EU 2.4 -1.0
Overall, BRICS countries saw a larger shift away from exports with the other bloc, while for G7 countries the shift within their own bloc was more pronounced. This implies that though BRICS countries are trading less with the G7, they are relying more on trade partners outside their bloc to make up for the lost G7 share.
A Global Shift in International Trade and Geopolitical Proximity
The movement towards strengthening trade relations based on geopolitical proximity is a global trend.
The United Nations categorizes countries along a scale of geopolitical proximity based on UN voting records.
According to the organization’s analysis, international trade between geopolitically close countries rose from the first quarter of 2022 (when Russia first invaded Ukraine) to the third quarter of 2023 by over 6%. Conversely, trade with geopolitically distant countries declined.
The second piece in this series will explore China’s gradual move away from using the U.S. dollar in trade settlements.
Visit the Hinrich Foundation to learn more about the future of geopolitical trade

-

 Economy4 hours ago
Economic Growth Forecasts for G7 and BRICS Countries in 2024
The IMF has released its economic growth forecasts for 2024. How do the G7 and BRICS countries compare?
-

 United States1 week ago
Ranked: The Largest U.S. Corporations by Number of Employees
We visualized the top U.S. companies by employees, revealing the massive scale of retailers like Walmart, Target, and Home Depot.
-

 Economy2 weeks ago
Where U.S. Inflation Hit the Hardest in March 2024
We visualized product categories that saw the highest % increase in price due to U.S. inflation as of March 2024.
-

 Economy4 weeks ago
G20 Inflation Rates: Feb 2024 vs COVID Peak
We visualize inflation rates across G20 countries as of Feb 2024, in the context of their COVID-19 pandemic peak.
-

 Economy1 month ago
Mapped: Unemployment Claims by State
This visual heatmap of unemployment claims by state highlights New York, California, and Alaska leading the country by a wide margin.
-

 Economy2 months ago
Confidence in the Global Economy, by Country
Will the global economy be stronger in 2024 than in 2023?


-

 Markets1 week ago
U.S. Debt Interest Payments Reach $1 Trillion
-

 Business2 weeks ago
Charted: Big Four Market Share by S&P 500 Audits
-

 Markets2 weeks ago
Ranked: The Most Valuable Housing Markets in America
-

 Money2 weeks ago
Which States Have the Highest Minimum Wage in America?
-

 AI2 weeks ago
Ranked: Semiconductor Companies by Industry Revenue Share
-

 Markets2 weeks ago
Ranked: The World’s Top Flight Routes, by Revenue
-

 Demographics2 weeks ago
Population Projections: The World’s 6 Largest Countries in 2075
-

 Markets2 weeks ago
The Top 10 States by Real GDP Growth in 2023