Energy
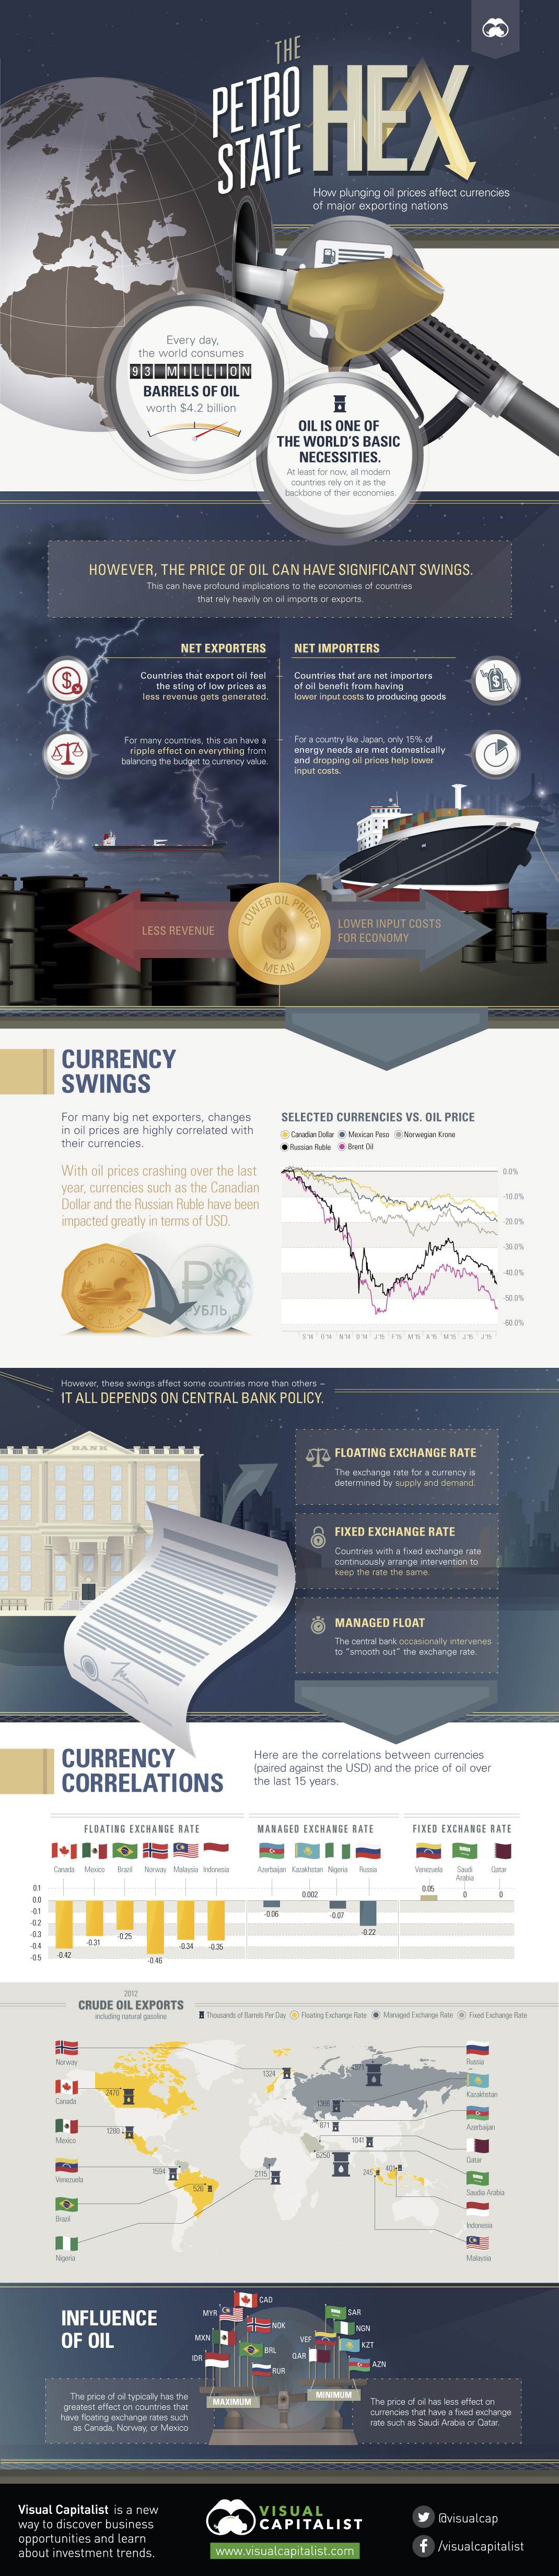
The Petrostate Hex: How Plunging Oil Prices Affect Currencies
The Petrostate Hex: How Plunging Oil Prices Affect Currencies
Every day, the world consumes 93 million barrels of oil, which is worth $4.2 billion.
Oil is one of the world’s most basic necessities. At least for now, all modern countries rely on oil and its derivatives as the backbone of their economies. However, the price of oil can have significant swings. These changes in price can have profound implications depending on whether an economy is a net importer or net exporter of crude.
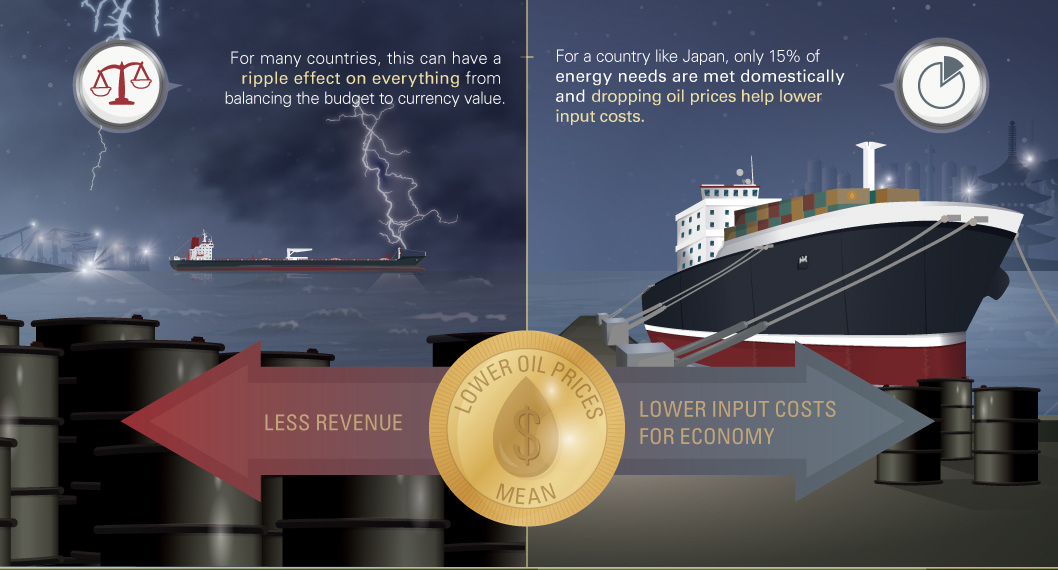
Net exporters, countries that sell more oil abroad than they bring in, feel the sting when prices plunge. Less revenue gets generated, and this can impact everything from balancing the budget to the value of their currency in the world market.
Net importers, on the other hand, benefit from lower prices as it decreases input costs for production. For example, a country like Japan only meets 15% of its energy needs domestically, and must import 3.5 million barrels of oil each day. A lower oil price significantly decreases these costs.
Currency Swings
For many major net exporters of oil, changes in oil prices are highly correlated with their currencies. With oil prices crashing over the last year, currencies such as the Canadian dollar and Russian ruble have been highly impacted in terms of USD.
For example, the ruble is down over 40% since the price of oil began to crash in 2014. With a breakeven cost of $105/bbl, the dropping price of crude as well as dwindling ruble have sent ripples through the Russian economy.
Central Bank Policy
The impact of oil on currency depends on how central banks approach policy:
Floating exchange rate: The exchange rate is determined by supply and demand.
Fixed exchange rate: Countries with fixed exchange rates continuously arrange intervention to keep the rate the same.
Managed float: The central bank occasionally intervenes to “smooth out” the exchange rate.
Currency Correlations
The price of oil typically has the largest effect on countries with floating exchange rates such as Canada, Norway, or Mexico. Over the last 15 years, the loonie (-0.42), krone (-0.46), and peso (-0.31) have all had large negative correlations in exchange rates (paired with USD) against the price of oil.
Meanwhile, countries that have pegged their rate tend to feel the impact of oil price swings elsewhere in their economy. This is because such countries have to buy or sell currencies on the open market to maintain the currency peg. Another method that can be used is to enforce a particular exchange rate by making it illegal to trade currencies at other rates, but this can often create a black market.
As a result, countries with fixed-rate policies such as Venezuela, Saudi Arabia, and Qatar have little to no correlation in their exchange rates (paired with USD) against the price of oil.


Energy
The World’s Biggest Nuclear Energy Producers
China has grown its nuclear capacity over the last decade, now ranking second on the list of top nuclear energy producers.


The World’s Biggest Nuclear Energy Producers
This was originally posted on our Voronoi app. Download the app for free on Apple or Android and discover incredible data-driven charts from a variety of trusted sources.
Scientists in South Korea recently broke a record in a nuclear fusion experiment. For 48 seconds, they sustained a temperature seven times that of the sun’s core.
But generating commercially viable energy from nuclear fusion still remains more science fiction than reality. Meanwhile, its more reliable sibling, nuclear fission, has been powering our world for many decades.
In this graphic, we visualized the top producers of nuclear energy by their share of the global total, measured in terawatt hours (TWh). Data for this was sourced from the Nuclear Energy Institute, last updated in August 2022.
Which Country Generates the Most Nuclear Energy?
Nuclear energy production in the U.S. is more than twice the amount produced by China (ranked second) and France (ranked third) put together. In total, the U.S. accounts for nearly 30% of global nuclear energy output.
However, nuclear power only accounts for one-fifth of America’s electricity supply. This is in contrast to France, which generates 60% of its electricity from nuclear plants.
| Rank | Country | Nuclear Energy Produced (TWh) | % of Total |
|---|---|---|---|
| 1 | 🇺🇸 U.S. | 772 | 29% |
| 2 | 🇨🇳 China | 383 | 14% |
| 3 | 🇫🇷 France | 363 | 14% |
| 4 | 🇷🇺 Russia | 208 | 8% |
| 5 | 🇰🇷 South Korea | 150 | 6% |
| 6 | 🇨🇦 Canada | 87 | 3% |
| 7 | 🇺🇦 Ukraine | 81 | 3% |
| 8 | 🇩🇪 Germany | 65 | 2% |
| 9 | 🇯🇵 Japan | 61 | 2% |
| 10 | 🇪🇸 Spain | 54 | 2% |
| 11 | 🇸🇪 Sweden | 51 | 2% |
| 12 | 🇧🇪 Belgium | 48 | 2% |
| 13 | 🇬🇧 UK | 42 | 2% |
| 14 | 🇮🇳 India | 40 | 2% |
| 15 | 🇨🇿 Czech Republic | 29 | 1% |
| N/A | 🌐 Other | 219 | 8% |
| N/A | 🌍 Total | 2,653 | 100% |
Another highlight is how China has rapidly grown its nuclear energy capabilities in the last decade. Between 2016 and 2021, for example, it increased its share of global nuclear energy output from less than 10% to more than 14%, overtaking France for second place.
On the opposite end, the UK’s share has slipped to 2% over the same time period.
Meanwhile, Ukraine has heavily relied on nuclear energy to power its grid. In March 2022, it lost access to its key Zaporizhzhia Nuclear Power Station after Russian forces wrested control of the facility. With six 1,000 MW reactors, the plant is one of the largest in Europe. It is currently not producing any power, and has been the site of recent drone attacks.

-

 Green2 weeks ago
Ranked: Top Countries by Total Forest Loss Since 2001
-

 Travel1 week ago
Ranked: The World’s Top Flight Routes, by Revenue
-

 Technology1 week ago
Ranked: Semiconductor Companies by Industry Revenue Share
-

 Money2 weeks ago
Which States Have the Highest Minimum Wage in America?
-

 Real Estate2 weeks ago
Ranked: The Most Valuable Housing Markets in America
-

 Markets2 weeks ago
Charted: Big Four Market Share by S&P 500 Audits
-

 AI2 weeks ago
The Stock Performance of U.S. Chipmakers So Far in 2024
-

 Automotive2 weeks ago
Almost Every EV Stock is Down After Q1 2024