Mining
The Looming Copper Supply Crunch

The Looming Copper Supply Crunch
This infographic is presented by Western Copper & Gold
Copper is among the three most used metals in the world, and high quantities of the red metal must be mined every year to meet global demand.
The market for copper is equal to approximately $120 billion each year, which rivals that of even iron ore, the most widely traded metal. This is because infrastructure, technology, and automobiles consume massive amounts of copper.
Behind silver, copper is the second best metal for conducting electricity. That’s why 75% of copper is used in electrical wires or for wiring in machinery. From power grids to motherboards, copper wire is indispensable to modern society.
Copper is also essential for green energy and a sustainable future. For example, each generation of car needs more copper wiring: a gasoline-powered car needs 55 lbs, while hybrids and electric vehicles need 110 lbs and 165 lbs respectively. Further, it is estimated that an average of 3.6 tonnes of copper is used for each MW of wind power.
The Copper Supply Problem
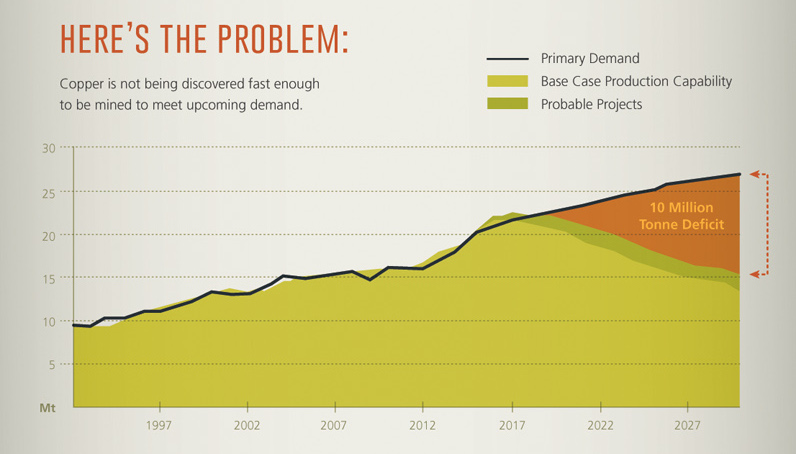
The problem is: copper is not being discovered fast enough to meet upcoming demand. A study by Wood Mackenzie found that there will be a 10 million tonne supply deficit by 2028. That’s equal to the annual production of the world’s biggest copper mine (Escondida) multiplied by a factor of ten.
There are several reasons for this.
First, it now takes longer to go from discovery to production than ever before in the mining industry. Geological, environmental, and political challenges have brought the average lead time to around 20 years for new mines.
Beyond all of the challenges above, the economics also have to line up. Thomson Reuters GFMS estimates that for new copper supply to be incentivized to come online, the copper price must be $3.50 per pound.
Copper mining is all about grade or scale. The majority of global output comes from mega mines that have massive economies of scale to reduce costs. However, it has been a long-running trend that the grades for these established mines are dropping.
A good example of this is Escondida, the world’s largest copper mine which is located in Chile. It produced 6% of global copper output in 2014, but the mine is facing a similar problem to that of other large copper projects: grades are dropping. In 2007, the copper grade was 1.72%, but it is predicted to drop to half of that in upcoming years. In fact, BHP Billiton is expecting a year-over-year decline of 24% between 2015 and 2016.
Codelco is the world’s largest copper miner overall, and has recently announced a $25 billion investment plan to expand aging mines. It will spend $5 billion each year, but it expects no significant gain in production for its efforts.
The Coming Supply Gap
Add these factors together, and stocks of copper are at their lowest levels since 2008. Further, 4% of the world’s copper mining capacity falls off the table each year, which means that this must be replaced somehow.
With 10 Escondidas needed to fill a 10 million tonne supply deficit by 2028, metals investors need to stay vigilant as changes in the market will be coming.


Mining
Charted: The Value Gap Between the Gold Price and Gold Miners
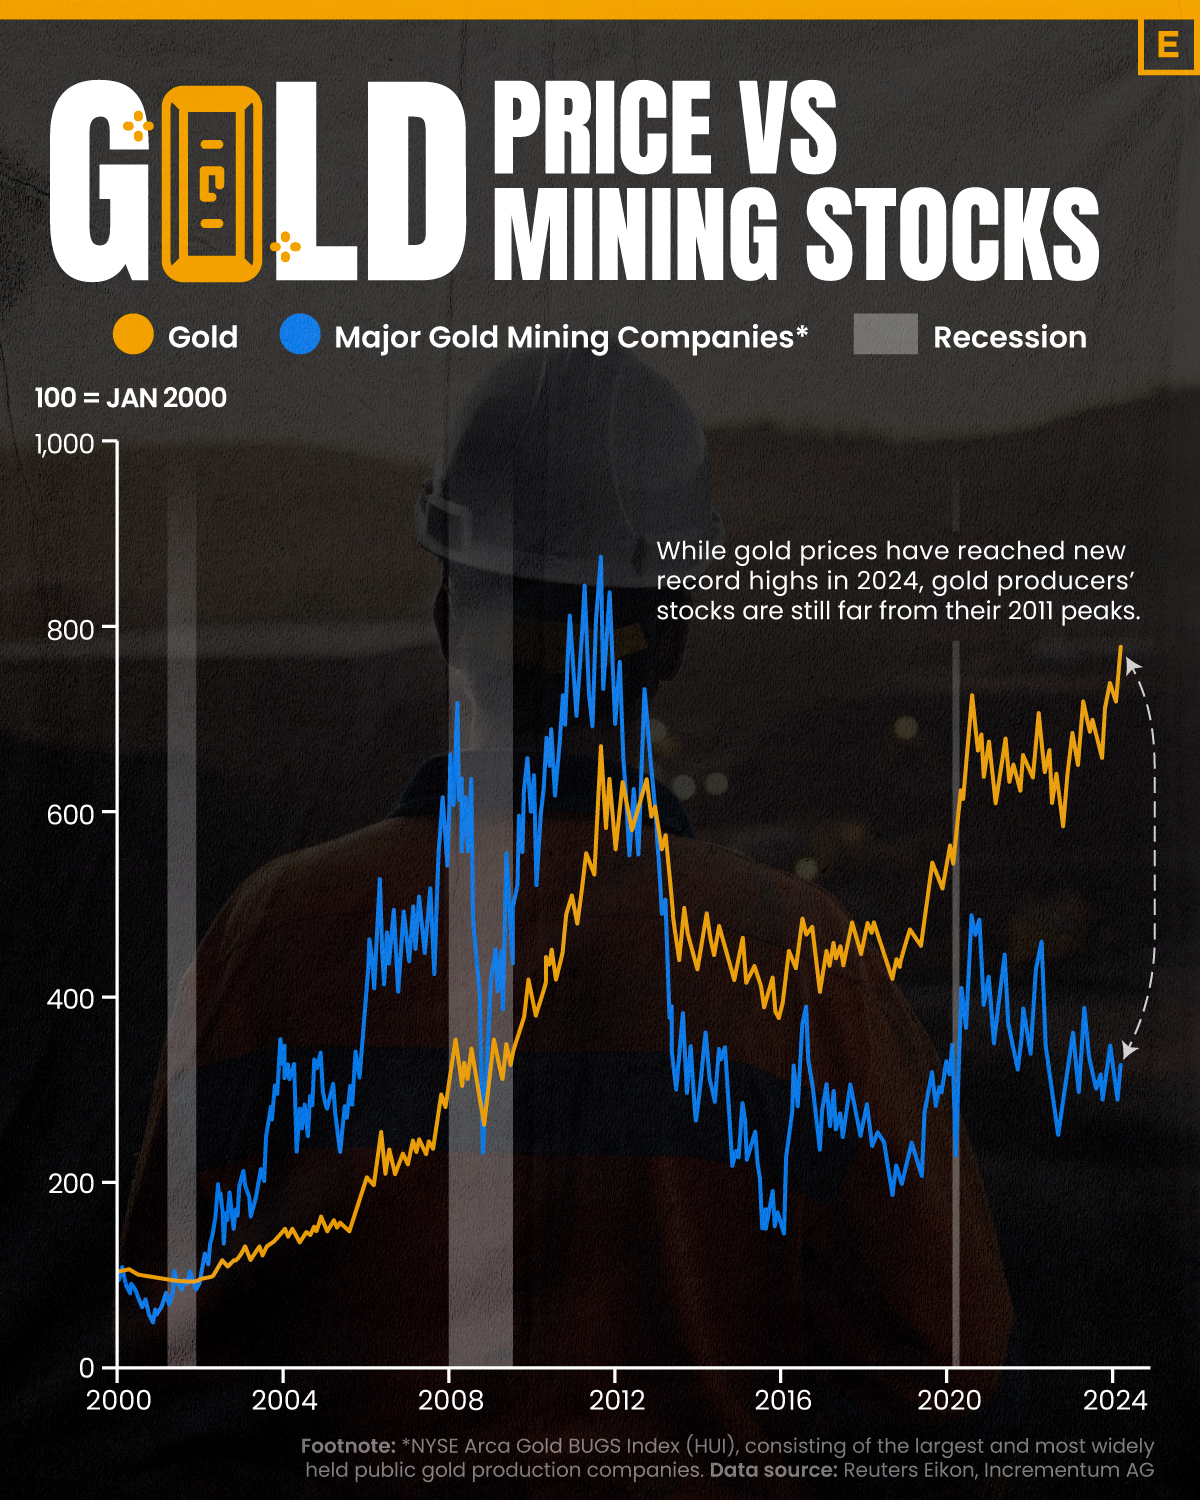
While the price of gold has reached new record highs in 2024, gold mining stocks are still far from their 2011 peaks.
The Value Gap Between the Gold Price and Gold Miners
This was originally posted on our Voronoi app. Download the app for free on Apple or Android and discover incredible data-driven charts from a variety of trusted sources.
Although the price of gold has reached new record highs in 2024, gold miners are still far from their 2011 peaks.
In this graphic, we illustrate the evolution of gold prices since 2000 compared to the NYSE Arca Gold BUGS Index (HUI), which consists of the largest and most widely held public gold production companies. The data was compiled by Incrementum AG.
Mining Stocks Lag Far Behind
In April 2024, gold reached a new record high as Federal Reserve Chair Jerome Powell signaled policymakers may delay interest rate cuts until clearer signs of declining inflation materialize.
Additionally, with elections occurring in more than 60 countries in 2024 and ongoing conflicts in Ukraine and Gaza, central banks are continuing to buy gold to strengthen their reserves, creating momentum for the metal.
Traditionally known as a hedge against inflation and a safe haven during times of political and economic uncertainty, gold has climbed over 11% so far this year.
According to Business Insider, gold miners experienced their best performance in a year in March 2024. During that month, the gold mining sector outperformed all other U.S. industries, surpassing even the performance of semiconductor stocks.
Still, physical gold has outperformed shares of gold-mining companies over the past three years by one of the largest margins in decades.
| Year | Gold Price | NYSE Arca Gold BUGS Index (HUI) |
|---|---|---|
| 2023 | $2,062.92 | $243.31 |
| 2022 | $1,824.32 | $229.75 |
| 2021 | $1,828.60 | $258.87 |
| 2020 | $1,895.10 | $299.64 |
| 2019 | $1,523.00 | $241.94 |
| 2018 | $1,281.65 | $160.58 |
| 2017 | $1,296.50 | $192.31 |
| 2016 | $1,151.70 | $182.31 |
| 2015 | $1,060.20 | $111.18 |
| 2014 | $1,199.25 | $164.03 |
| 2013 | $1,201.50 | $197.70 |
| 2012 | $1,664.00 | $444.22 |
| 2011 | $1,574.50 | $498.73 |
| 2010 | $1,410.25 | $573.32 |
| 2009 | $1,104.00 | $429.91 |
| 2008 | $865.00 | $302.41 |
| 2007 | $836.50 | $409.37 |
| 2006 | $635.70 | $338.24 |
| 2005 | $513.00 | $276.90 |
| 2004 | $438.00 | $215.33 |
| 2003 | $417.25 | $242.93 |
| 2002 | $342.75 | $145.12 |
| 2001 | $276.50 | $65.20 |
| 2000 | $272.65 | $40.97 |
Among the largest companies on the NYSE Arca Gold BUGS Index, Colorado-based Newmont has experienced a 24% drop in its share price over the past year. Similarly, Canadian Barrick Gold also saw a decline of 6.5% over the past 12 months.

-
 Money2 weeks ago
Visualizing the Growth of $100, by Asset Class (1970-2023)
-

 Money1 week ago
Where Does One U.S. Tax Dollar Go?
-

 Green2 weeks ago
Ranked: Top Countries by Total Forest Loss Since 2001
-

 Real Estate2 weeks ago
Visualizing America’s Shortage of Affordable Homes
-

 Maps2 weeks ago
Mapped: Average Wages Across Europe
-

 Mining2 weeks ago
Charted: The Value Gap Between the Gold Price and Gold Miners
-

 Demographics2 weeks ago
Visualizing the Size of the Global Senior Population
-

 Automotive2 weeks ago
Tesla Is Once Again the World’s Best-Selling EV Company