Datastream
A Historical Divide: A 160-Year View of the Gold-Oil Ratio


The Briefing
- The divergence had gold trading at nearly 91 times oil in April.
- The price relationship between gold and oil is at levels not witnessed in 160 years.
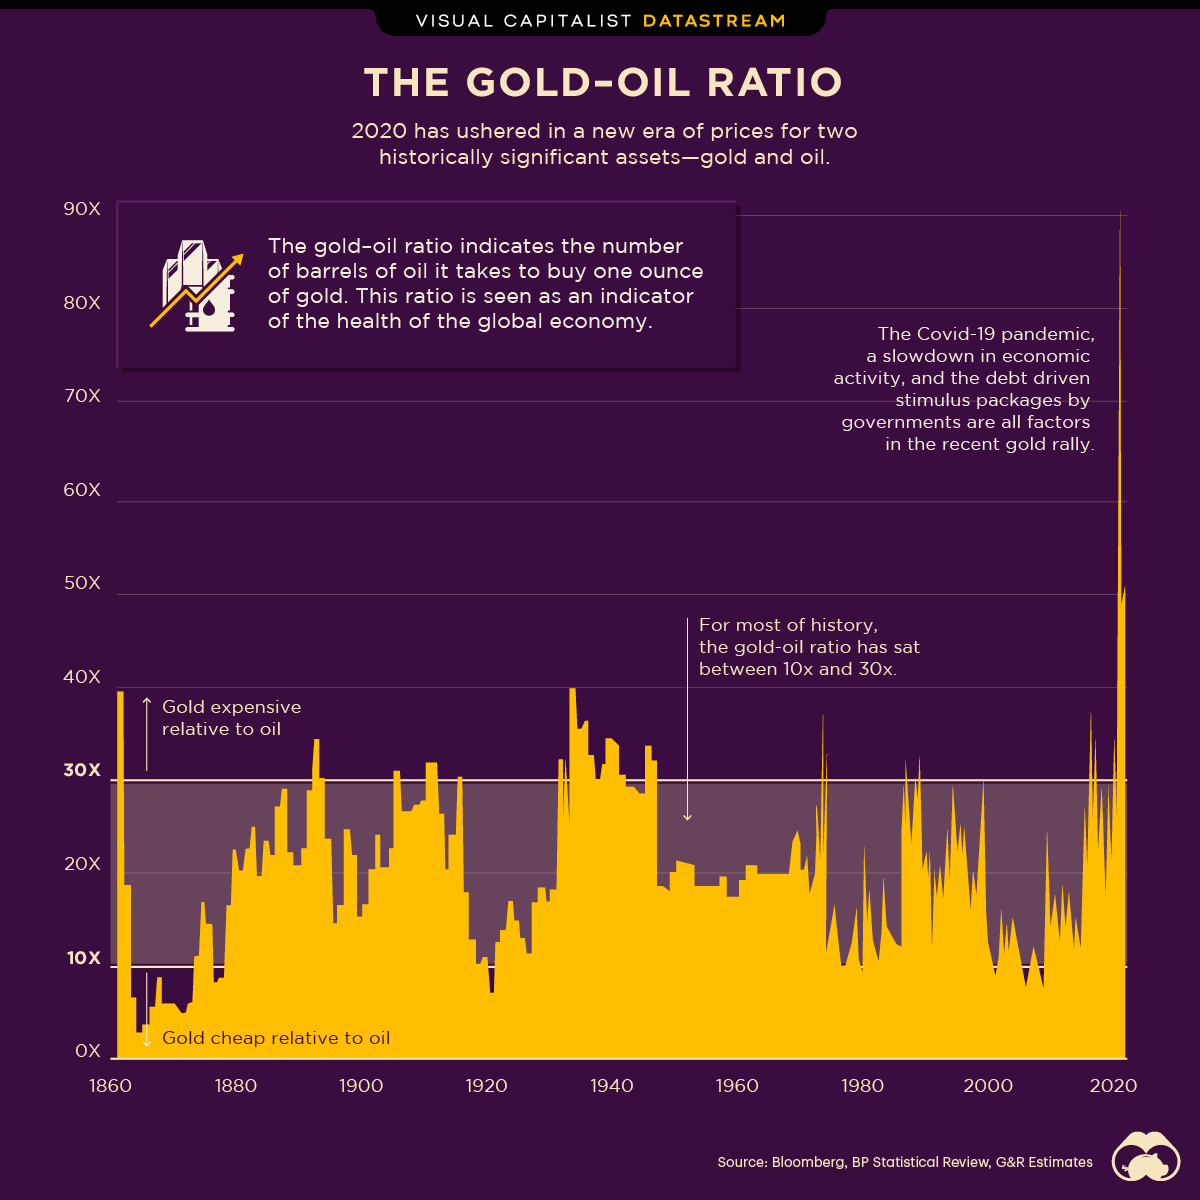
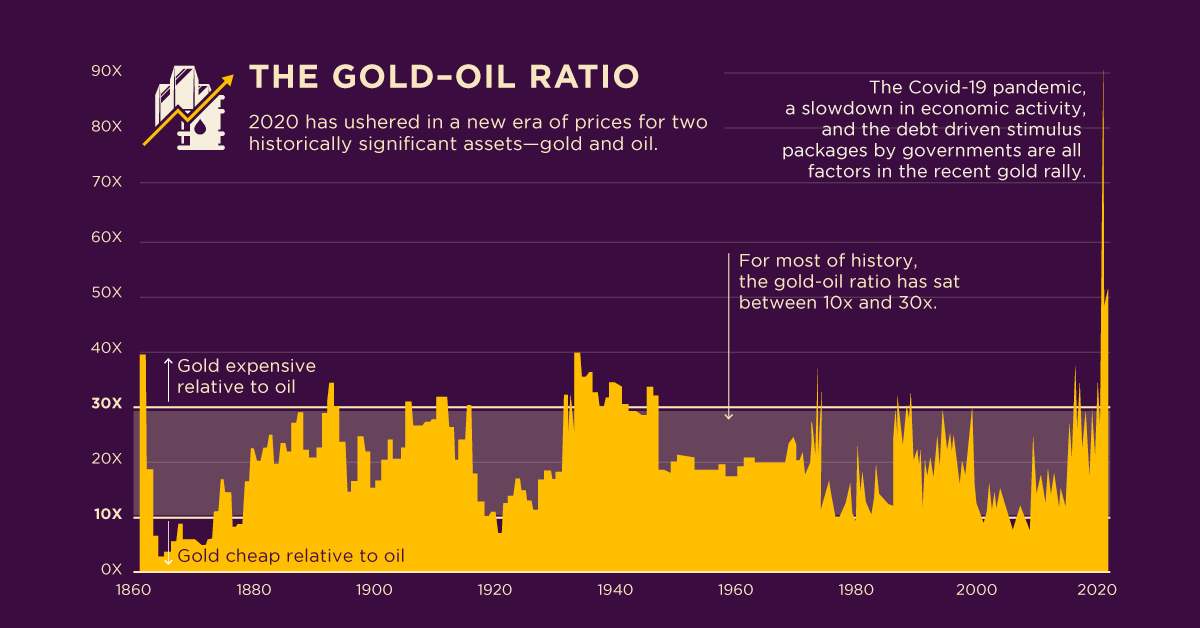
A 160 Year View of the Gold-Oil Ratio
2020 has ushered in a new era of prices for two historically significant assets—gold and oil.
The market has driven the pair in polar opposite directions breaking historical patterns. This year, gold brushed above $2,000 an ounce, while oil futures even went temporarily negative in the spring. The gold-oil ratio tells us how many barrels of West Texas Intermediate (WTI) are needed to buy an ounce of gold, serving as a price-based indicator of the relative value of these two important assets.
Historically, the ratio has averaged between 10:1 and 30:1, This year it brushed above 90:1.
Here’s a look at the price of gold and oil over the last 6 months:
| Month | Gold-Oil Ratio | Gold $ per Oz | Oil $ per Barrel (WTI) |
|---|---|---|---|
| April 2020 | 91.12 | $1,716.75 | $18.84 |
| May 2020 | 48.62 | $1,725.65 | $35.49 |
| June 2020 | 45.09 | $1,770.70 | $39.27 |
| July 2020 | 48.96 | $1,971.68 | $40.27 |
| August 2020 | 46.25 | $1,970.50 | $42.61 |
| September 2020 | 47.09 | $1,893.90 | $40.22 |
| October 2020 | 52.53 | $1,879.90 | $35.79 |
The Gold Story
Traditional investing mantra tells us gold acts as an alternative investment, a haven if you will, that appreciates in price during tumultuous economic and financial times.
Its limited quantity and physical storage properties serve as a hedge to much of modern finance that is increasingly digital.
The COVID-19 pandemic, a subsequent slowdown in economic activity, and the debt-driven stimulus packages by governments globally are all factors in the recent gold rally.
The Oil Story
At the other end are the oil markets, which face both long and short-term headwinds. Long-term demand for oil has dwindled gradually as societies buff up their alternative and green energy initiatives.
Shrinking activity during the pandemic was the short-term shock. Combined, the outcomes include oil futures going negative in spring, Chevron reporting a net income loss of $8.3 billion in the second quarter, and Exxon’s dumping from The Dow.
As markets adapt to the volatile nature of 2020, only time will tell what the future holds for the gold-oil ratio.
Where does this data come from?
- Source: Goehring & Rozencwajg: Top Reasons to Consider Oil-Related Equities report and MacroTrends
- Notes: Data is as of October 2020.


Datastream
Can You Calculate Your Daily Carbon Footprint?
Discover how the average person’s carbon footprint impacts the environment and learn how carbon credits can offset your carbon footprint.


The Briefing
- A person’s carbon footprint is substantial, with activities such as food consumption creating as much as 4,500 g of CO₂ emissions daily.
- By purchasing carbon credits from Carbon Streaming Corporation, you can offset your own emissions and fund positive climate action.
Your Everyday Carbon Footprint
While many large businesses and countries have committed to net-zero goals, it is essential to acknowledge that your everyday activities also contribute to global emissions.
In this graphic, sponsored by Carbon Streaming Corporation, we will explore how the choices we make and the products we use have a profound impact on our carbon footprint.
Carbon Emissions by Activity
Here are some of the daily activities and products of the average person and their carbon footprint, according to Clever Carbon.
| Household Activities & Products | CO2 Emissions (g) |
|---|---|
| 💡 Standard Light Bulb (100 watts, four hours) | 172 g |
| 📱 Mobile Phone Use (195 minutes per day)* | 189 g |
| 👕 Washing Machine (0.63 kWh) | 275 g |
| 🔥 Electric Oven (1.56 kWh) | 675 g |
| ♨️ Tumble Dryer (2.5 kWh) | 1,000 g |
| 🧻 Toilet Roll (2 ply) | 1,300 g |
| 🚿 Hot Shower (10 mins) | 2,000 g |
| 🚙 Daily Commute (one hour, by car) | 3,360 g |
| 🍽️ Average Daily Food Consumption (three meals of 600 calories) | 4,500 g |
| *Phone use based on yearly use of 69kg per the source, Reboxed | |
Your choice of transportation plays a crucial role in determining your carbon footprint. For instance, a 15 km daily commute to work on public transport generates an average of 1,464 g of CO₂ emissions. Compared to 3,360 g—twice the volume for a journey the same length by car.
By opting for more sustainable modes of transport, such as cycling, walking, or public transportation, you can significantly reduce your carbon footprint.
Addressing Your Carbon Footprint
One way to compensate for your emissions is by purchasing high-quality carbon credits.
Carbon credits are used to help fund projects that avoid, reduce or remove CO₂ emissions. This includes nature-based solutions such as reforestation and improved forest management, or technology-based solutions such as the production of biochar and carbon capture and storage (CCS).
While carbon credits offer a potential solution for individuals to help reduce global emissions, public awareness remains a significant challenge. A BCG-Patch survey revealed that only 34% of U.S. consumers are familiar with carbon credits, and only 3% have purchased them in the past.
About Carbon Streaming
By financing the creation or expansion of carbon projects, Carbon Streaming Corporation secures the rights to future carbon credits generated by these sustainable projects. You can then purchase these carbon credits to help fund climate solutions around the world and compensate for your own emissions.
Ready to get involved?
>> Learn more about purchasing carbon credits at Carbon Streaming

-

 Maps2 weeks ago
Mapped: Average Wages Across Europe
-

 Money1 week ago
Which States Have the Highest Minimum Wage in America?
-

 Real Estate1 week ago
Ranked: The Most Valuable Housing Markets in America
-

 Markets1 week ago
Charted: Big Four Market Share by S&P 500 Audits
-

 AI1 week ago
The Stock Performance of U.S. Chipmakers So Far in 2024
-

 Automotive2 weeks ago
Almost Every EV Stock is Down After Q1 2024
-

 Money2 weeks ago
Where Does One U.S. Tax Dollar Go?
-

 Green2 weeks ago
Ranked: Top Countries by Total Forest Loss Since 2001