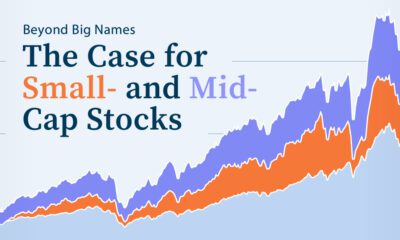

Small- and mid-cap stocks have historically outperformed large caps. What are the opportunities and risks to consider?
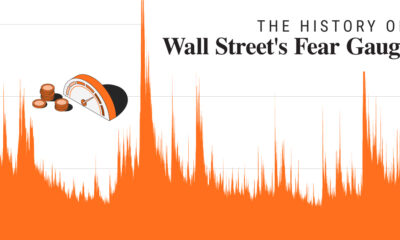

In 2023, market volatility has fallen dramatically. In this graphic, we show how it compares to historical trends.
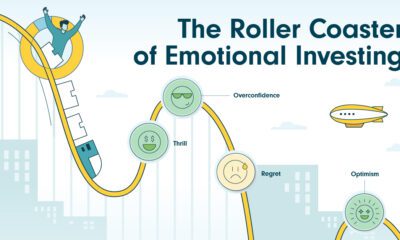

90% of investing is driven by emotions. But controlling impulses in turbulent markets is key to protecting your portfolio in the long run.
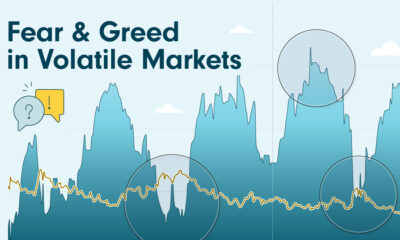

CNN's Fear & Greed Index captures investor confidence levels, usually reflecting market volatility. It increases during periods of greed in the markets and decreases when investors...


This infographic visualizes 10-year annualized forecasts for both equities and fixed income using data from Vanguard.
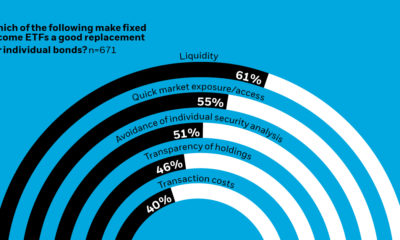

Fixed income ETFs are a go-to tool for institutional investors. Find out why professionals use them in this graphic.
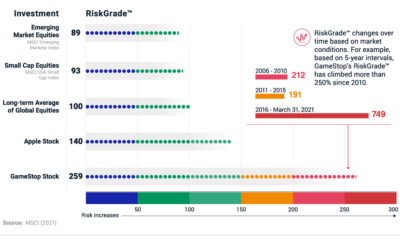

RiskGrade allows for apples-to-apples comparisons of investment risk. For example, GameStop was 2.5 times more risky than global equities.
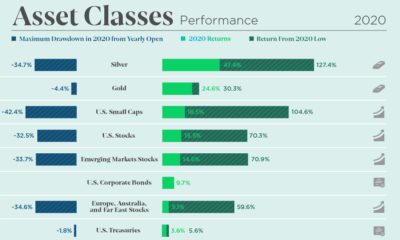

The markets were volatile but offered great opportunity in 2020. See how every asset class, currency, and S&P 500 sector performed over the year.
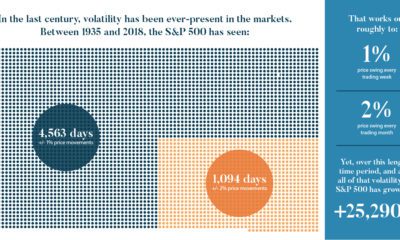

We look at the last century of markets to discover five important lessons about volatility. Here's what you should know about volatility going forward.
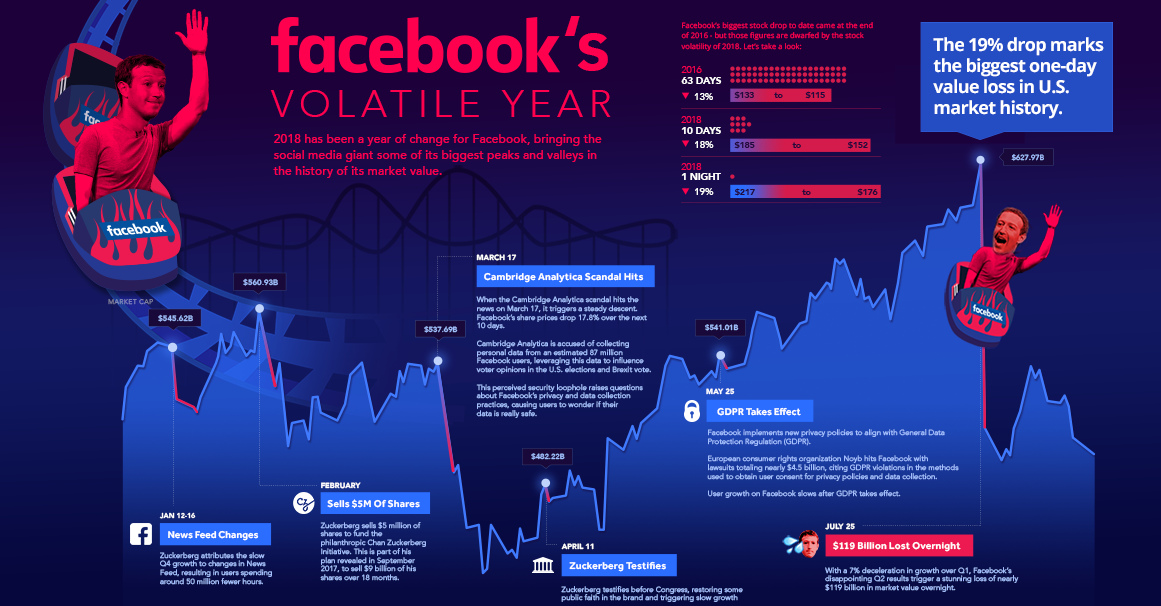
From privacy scandals to falling user engagement, it's been a wild ride for Facebook in 2018. We recap Facebook's volatile year in this massive chart.


