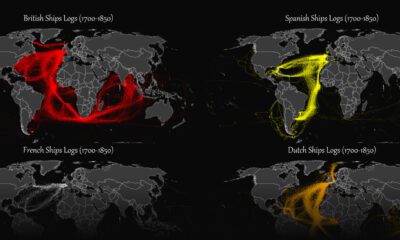

This map plots the colonial shipping lanes used by the British, the French, the Spanish, and the Dutch in the 18th and 19th centuries.


What does a road map of the world look like? Here’s a deep view of roads visualized by type across countries and continents.
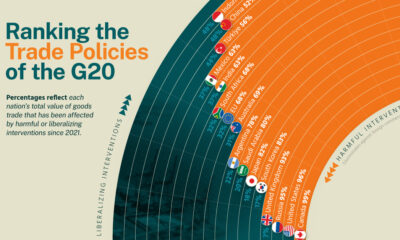

We analyze recent trade policies implemented by G20 members to determine whether they are liberalizing or harmful.
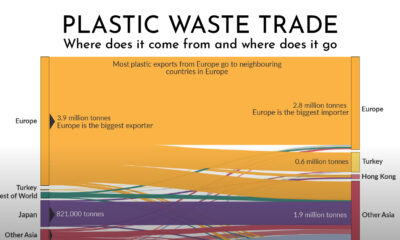

Which countries are responsible for exporting the world's plastic waste? This graphic shows the flow of global plastic waste through exports and imports.
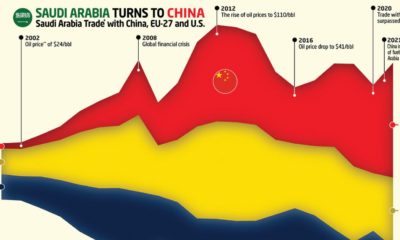

This graphic charts Saudi Arabia’s trading history with the EU, the U.S., and it's new largest trading partner — China.
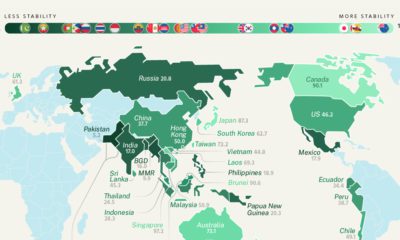

Prior to invading Ukraine, Russia had one of the highest levels of geopolitical risk. How does geopolitical uncertainty vary around the world?
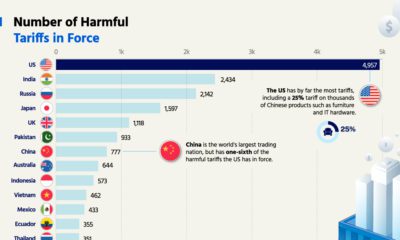

The U.S. has by far the most harmful tariffs, with nearly 5,000 in force. Which economy has the least tariffs?
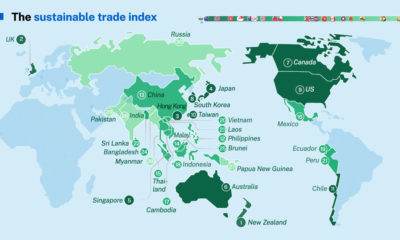

See which economies have the most sustainable trade policies in the Hinrich Foundation's 2022 Sustainable Trade Index.


A handful of materials are increasingly crucial for the next generation of emerging technologies. But as the data shows, the U.S. is heavily reliant on foreign...
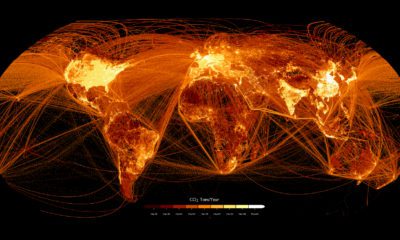

This graphic maps out carbon emissions around the world and where they come from, using data from the European Commission.


 Creator Program