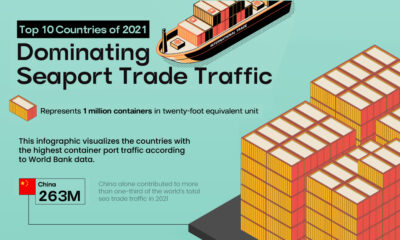

This infographic highlights the countries with the highest container traffic across their ports, thus dominating seaport trade in 2021.
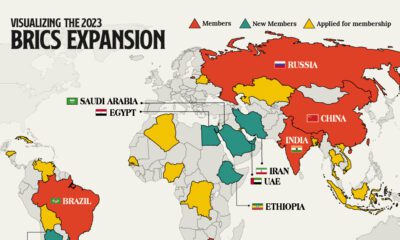

We provide a data-driven overview of how the recent BRICS expansion will grow the group’s influence and reach.
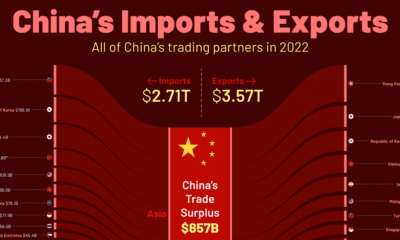

China trades with more than 200 countries globally. Here's how China's trade partners break down by import and export destinations.
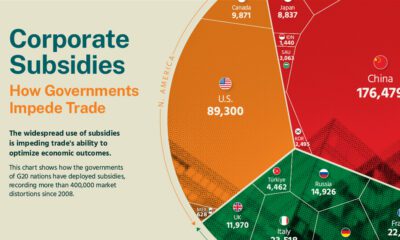

The Hinrich Foundation visualizes the impact of corporate subsidies by G20 nations between 2008 and Q1 2023.
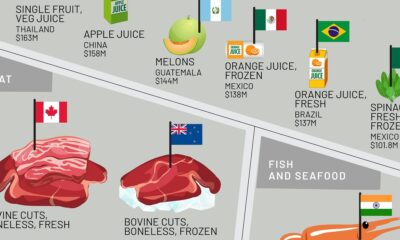

This infographic shows the top exporting countries for U.S. food imports, ranging from exotic fruits to meat, oils, spices, and more.


The U.S. is heavily reliant on imports for many critical minerals. How import-dependent is the U.S. for each one, and on which country?
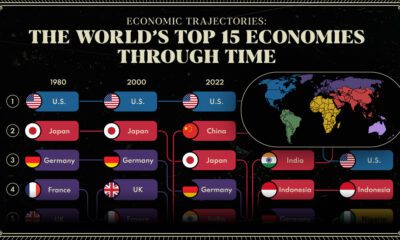

We provide a historical and predictive overview of the top economies in the world, including projections all the way to 2075.
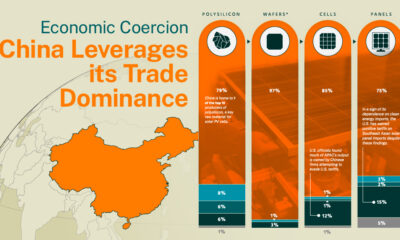

The Hinrich Foundation explores China's use of economic coercion and the implications of its control over the solar energy sector.
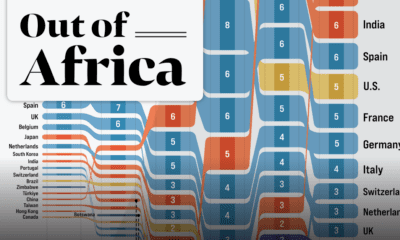

In 2020 the African continent exported nearly $378 billion worth of goods. Here are the top destinations for 25 years of Africa’s exports.


How do you visualize trade? These 9 graphics on the topic are the shortlist winners of our inaugural Creator Program Challenge.


 Creator Program