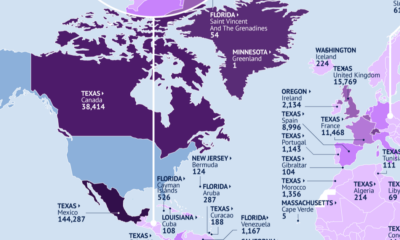

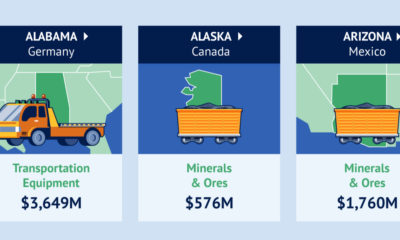
This map identifies the biggest U.S. export markets by state, showing the top partner of each country by value of goods imported.

Canada is the top destination for products from 21 states.
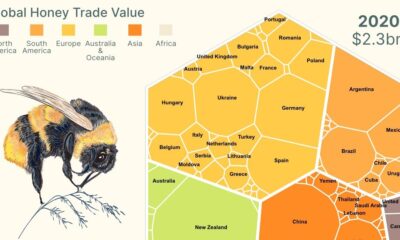

This infographic breaks down global honey exports and shows the power of Mānuka honey exports from New Zealand.


This graphic illustrates Panama Canal traffic by shipment category, looking at the total number of shipping crossings and the total tonnage.


China holds the position of both the top importer and exporter with MENA countries by volume.


Today, China dominates the trade market, accounting for almost 15% of all merchandise.
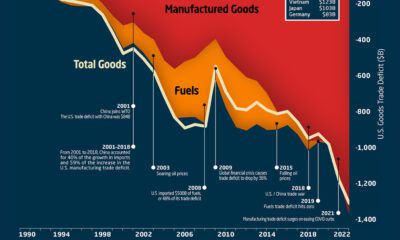

This graphic the U.S. trade deficit growth since 1990, and how manufactured goods and fuels factor in over the last three decades.
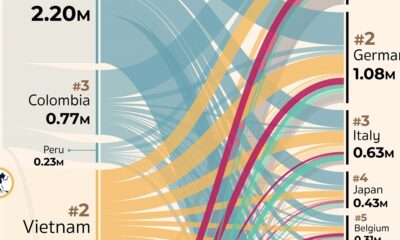

Which countries export, and import, the most coffee? This visual highlights the global coffee trade by export flows in 2019.
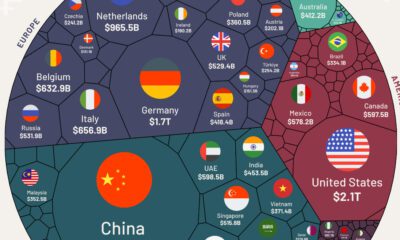

We visualize nearly $25 trillion of global exports by country, showing you the top exporting nations and the data behind it all.


Data from the World Trade Organization highlights the world's 10 largest automotive exporters in 2022.


 Creator Program