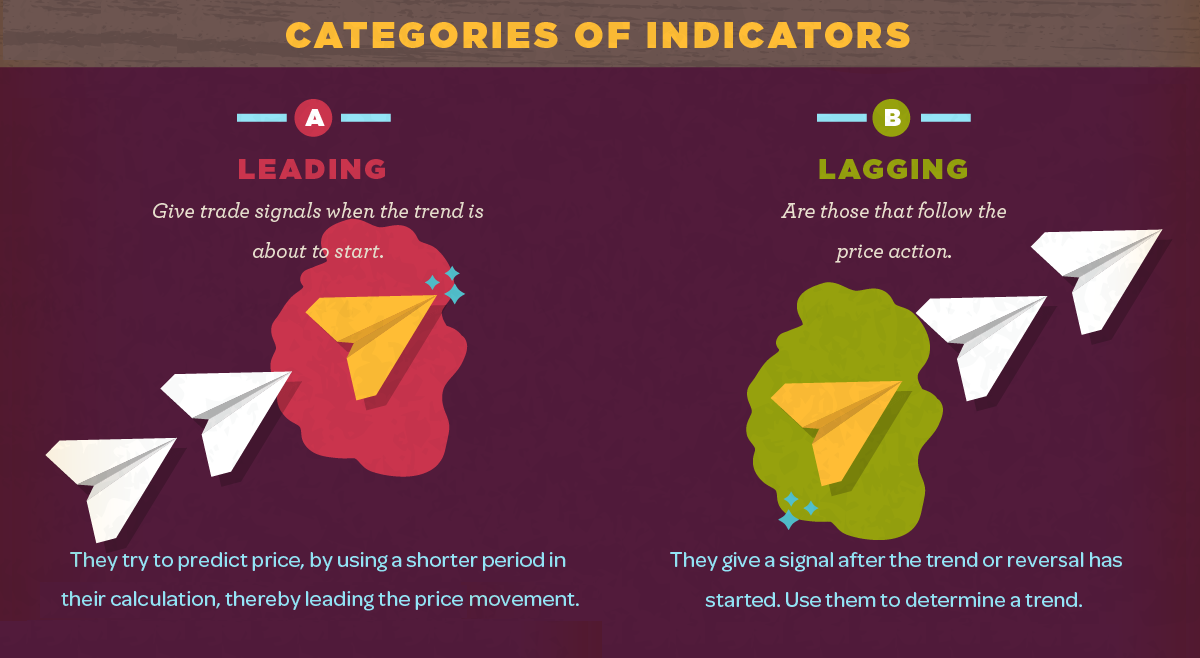
Many professional stock traders use technical indicators to help them with trade timing or to alert them of new trends. Here's what they are all about.
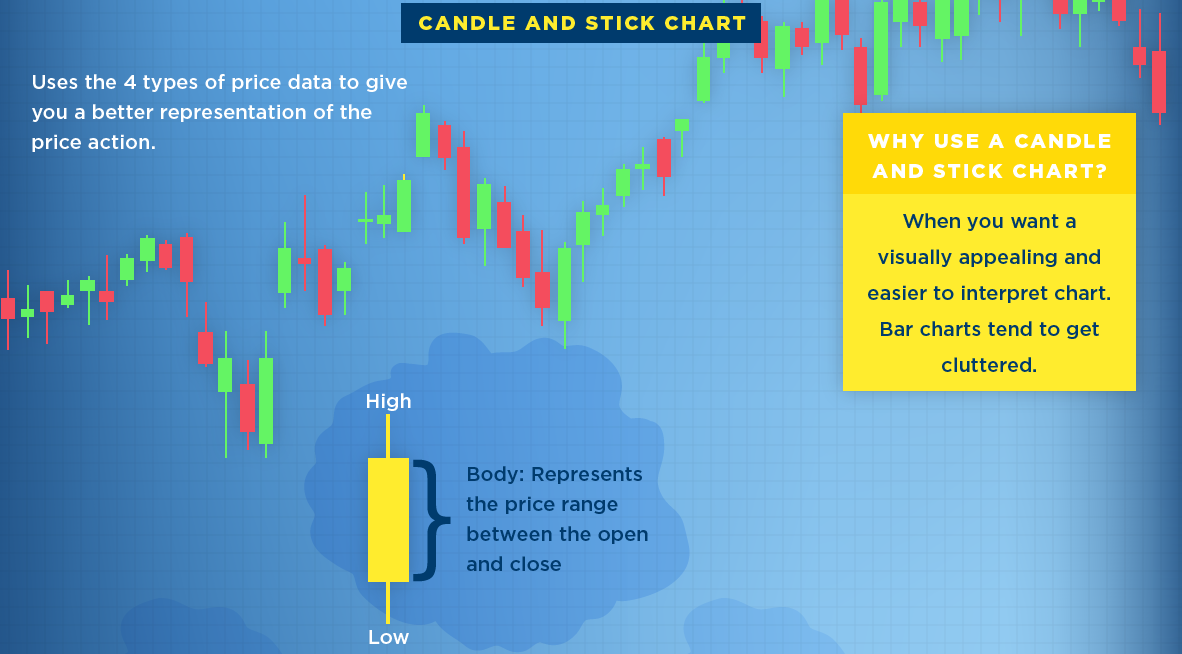
What is a stock chart? Here's three of the most common types of stock charts, along with a description of the data they typically provide investors.
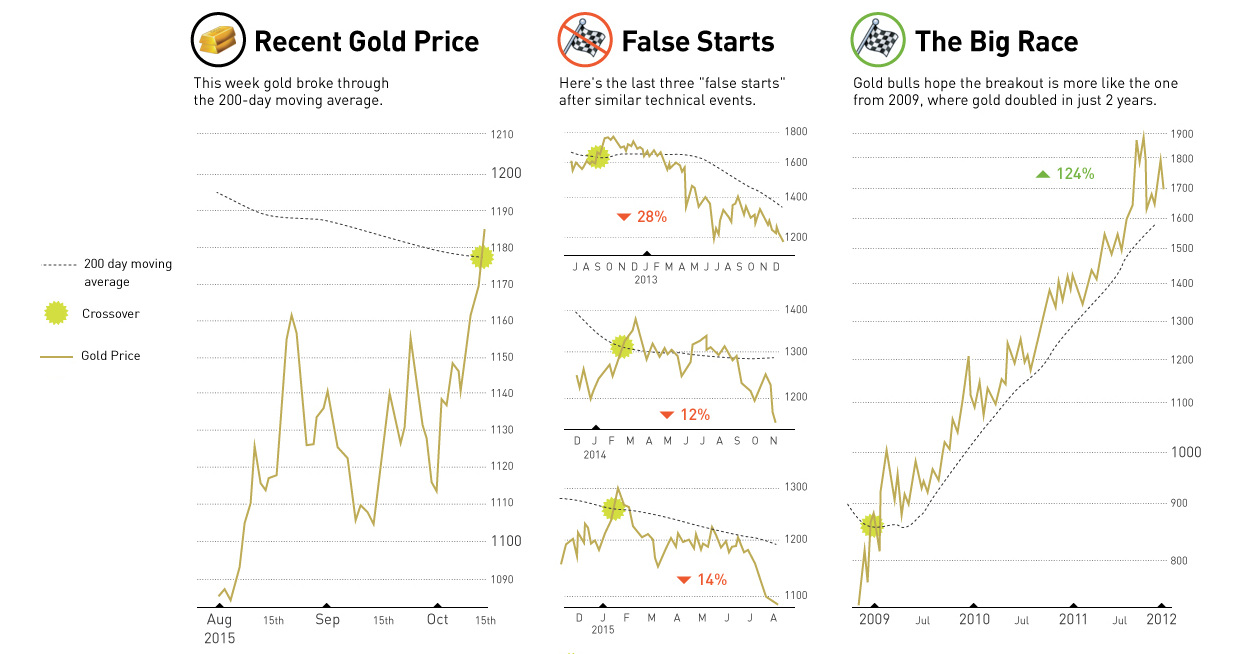
This week, gold made a technical breakthrough past its 200-day moving average. We look at past occurrences of this event, and the potential consequences.
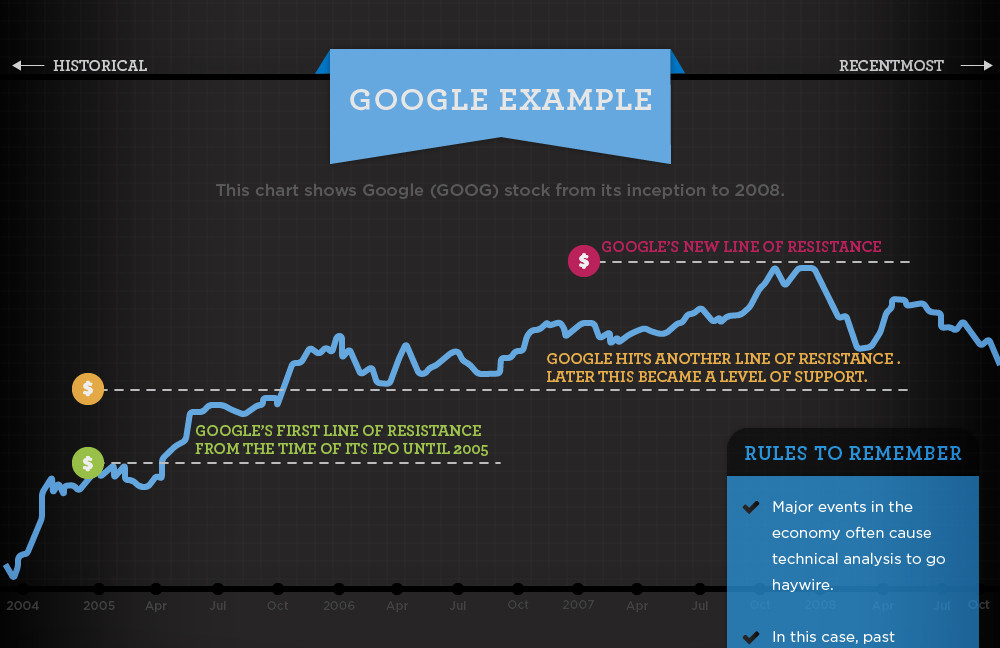
Basic Stock Chart Technical Analysis I know plenty of investors that have their eyes gloss over when they hear terms like “head and shoulders” and “falling...


