

Last year, the share of affordable homes in the U.S. reached its lowest point on record amid high interest rates and soaring home prices.

In this graphic, we show asset class returns across U.S. equities, bonds, real estate, gold and cash since 1970.


As U.S. home prices hit record highs, which housing market is seen the fastest growth? This graphic shows the top 10 across the country.


We chart the ever-widening gap between median incomes and the median price of houses in America, using data from the Federal Reserve from 1984 to 2022.


What are the top retirement planning mistakes people make? Here are the top 10 common mistakes to avoid as seen by financial professionals.


Between equities, real estate, commodities, bonds, and emerging markets, we track which major asset class ended the year on a positive note.


This infographic ranks the 20 most popular neighborhoods in the U.S. for homebuyers based on search interest.
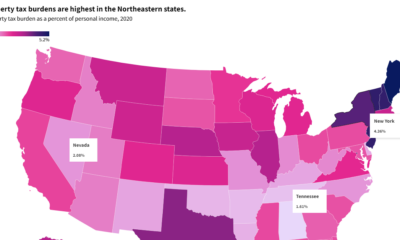

This interactive graphic shows property taxes by state in the U.S. as a percentage of personal income in 2020.


We highlight the top 15 U.S. metro areas by their percentage of million-dollar homes, from San Francisco to Miami.


Services-producing industries account for the majority of U.S. GDP in 2023, followed by other private industries and the government.


 Creator Program