

This visual heatmap of unemployment claims by state highlights New York, California, and Alaska leading the country by a wide margin.
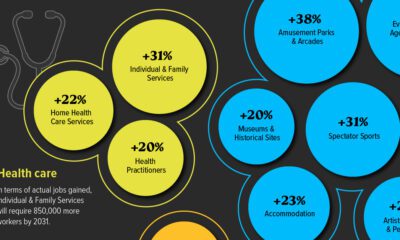

Key sectors in the U.S.—including Leisure and Health Social Services—are projected to be the fastest growing industries over the next decade.
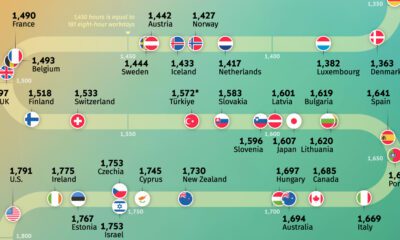

Where do people work the most? Explore our analysis of the average annual working hours across OECD countries.
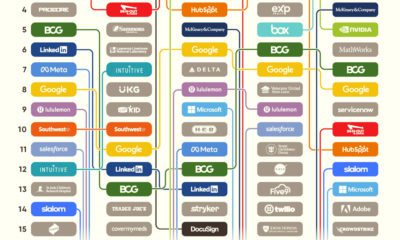

According to employee reviews on Glassdoor, here's how the ranking of top-rated employers in the U.S. has changed over the last five years
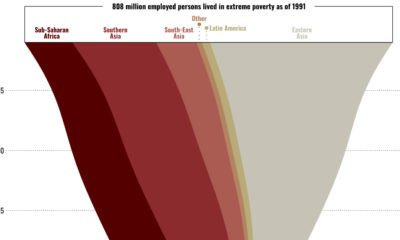

This graphic shows the regional breakdown of the world’s working poor, and how this demographic has changed since 1995.
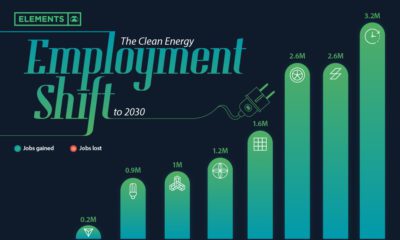

Will the clean energy transition create jobs, or will jobs be lost? Here is projected employment growth in clean energy and related sectors to 2030.
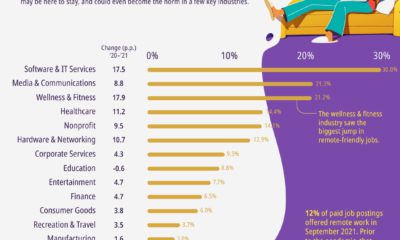

Remote job postings are up nearly across the board, but a few key industries are have seen a significant shift over the last year.
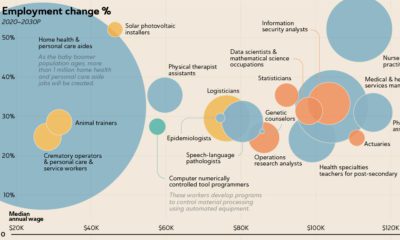

The U.S. Bureau of Labor Statistics predicts an overall job growth rate of 7.7%. Here, we show the fastest growing jobs and how much they pay.
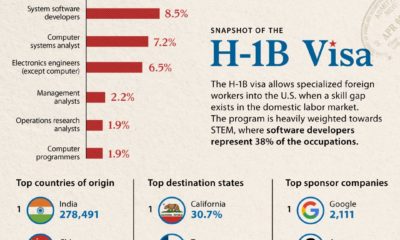

This infographic covers all the key charts and data for the H1-B visa, which grants foreign skilled workers employment in the U.S.
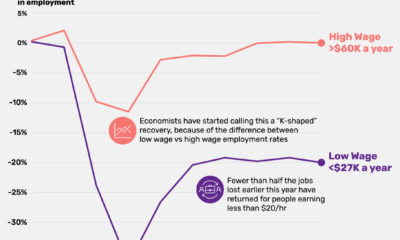

The current recession is the most unequal in modern history, with employment rates diverging greatly between high versus low wage workers.


 Creator Program