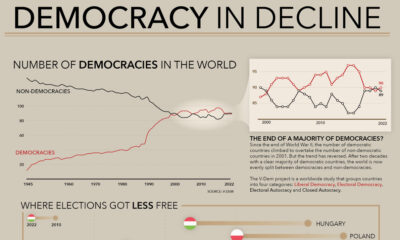

How many democracies does the world have? This visual shows the change since 1945 and the top nations becoming more (and less) democratic.
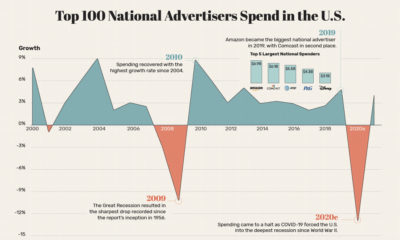

This graphic visualizes the fluctuations in advertising spend in the U.S., along with its brutal decline of 13% as a result of COVID-19.
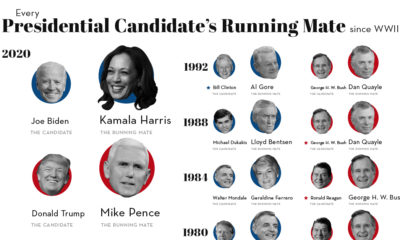

Picking the right VP makes all the difference to a President's success. We look at running mates of all Presidential hopefuls since 1940.
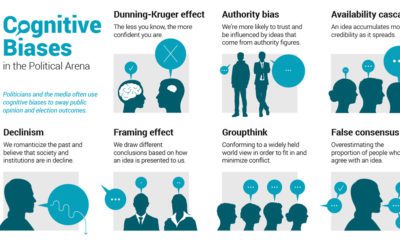

Humans are hardwired to make mental mistakes called cognitive biases. Here are common biases that can shape political opinion, and even elections.
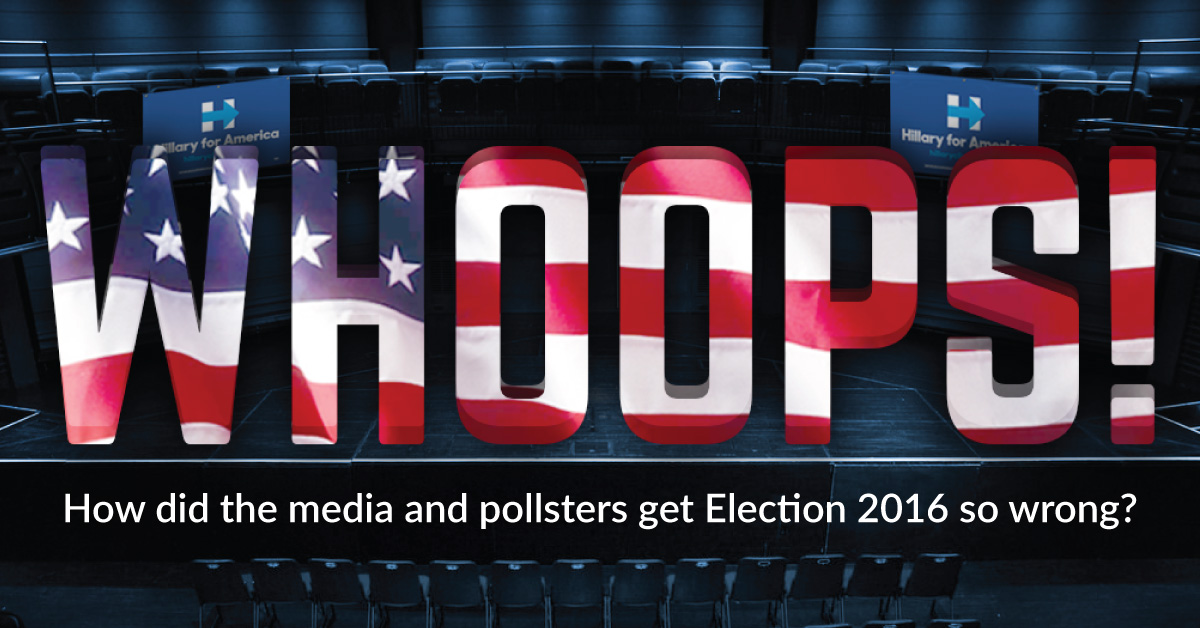
The day before the election, pollsters had pegged Hillary Clinton’s chances of winning at greater than 90%. They were wrong. Very wrong.
Election day is finally here. Here's 10 charts and maps that will be central to the story as America makes its historical decision.
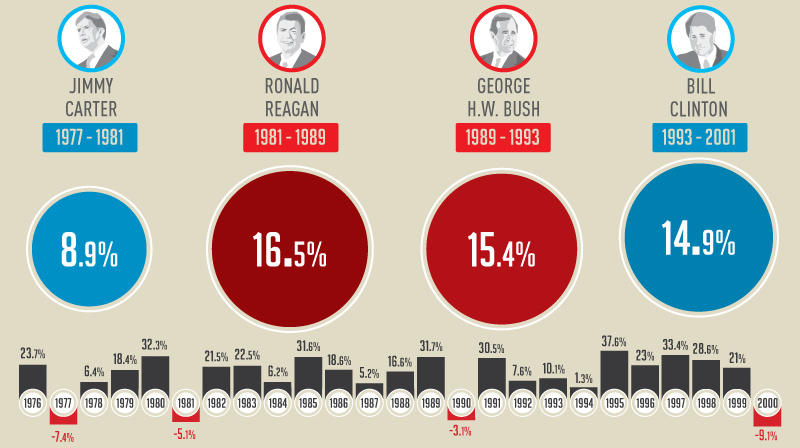
This infographic shows how the U.S. market performs in each year of a presidential term - and specifically, how the market does in election years.
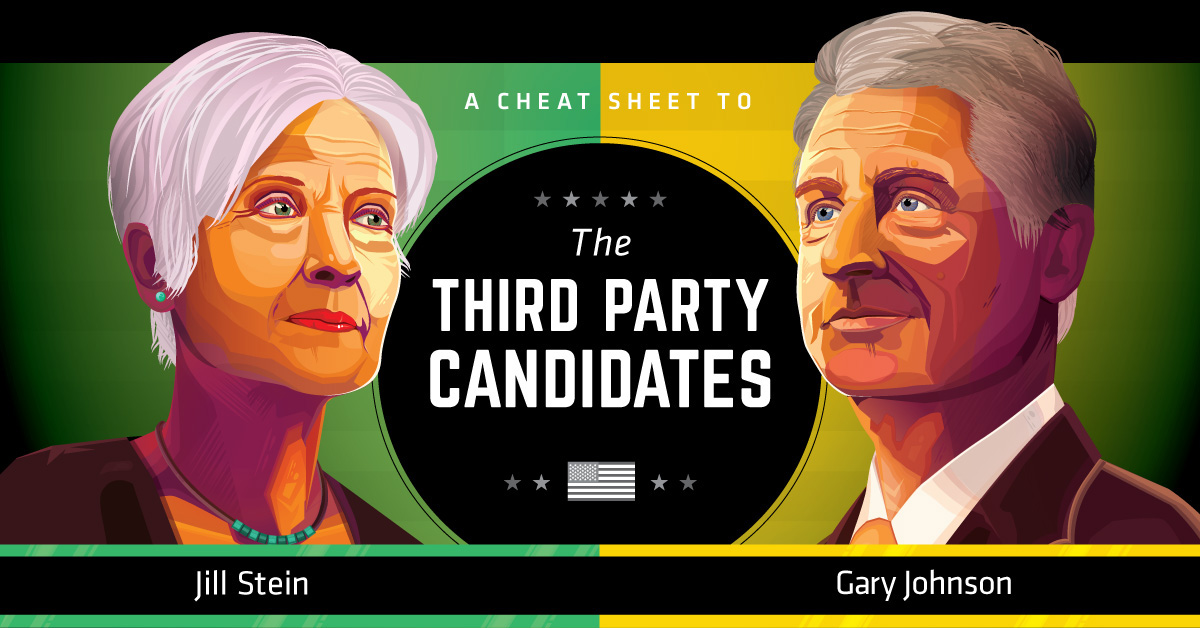
This infographic serves as a cheat sheet to the third party candidates in the U.S. Election, covering what Gary Johnson and Jill Stein are all about.
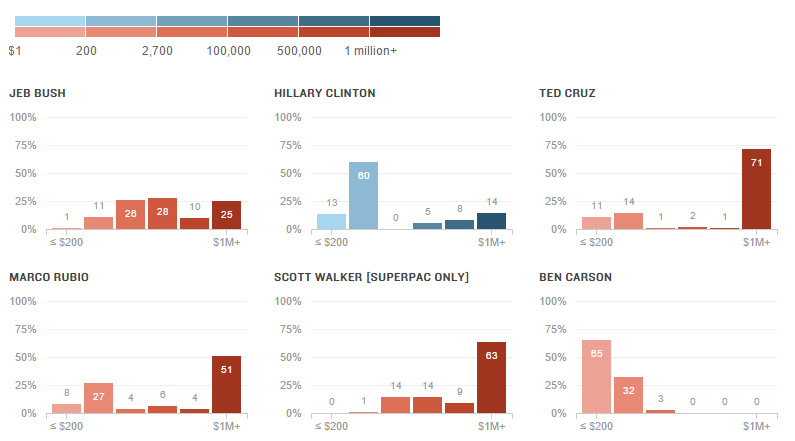
The candidates for the 2016 presidential race are employing a variety of strategies to fund their campaigns. Here's a breakdown of funding by donation size.


 Creator Program