

Between equities, real estate, commodities, bonds, and emerging markets, we track which major asset class ended the year on a positive note.
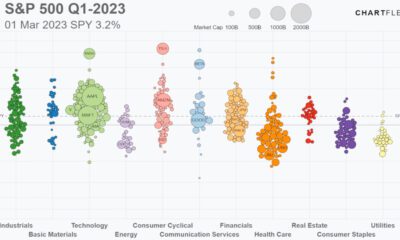

Track the S&P 500’s performance in 2023, including all 500 companies, and the sectors they belong to, in this animated video.
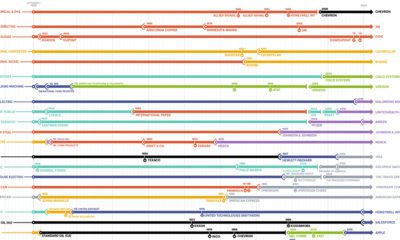

The Dow Jones Industrial Average is constantly evolving. This chart tracks which companies have come and gone since the inception of the index in 1928.
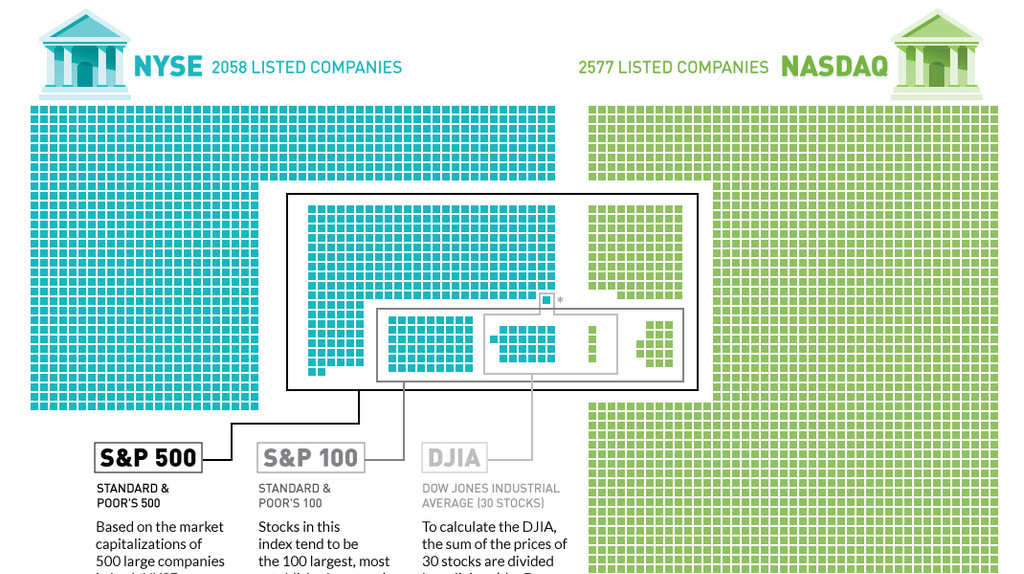
Plotting the 4,500+ companies on the NYSE and NASDAQ to show how the S&P 500, S&P 100, and Dow are derived.
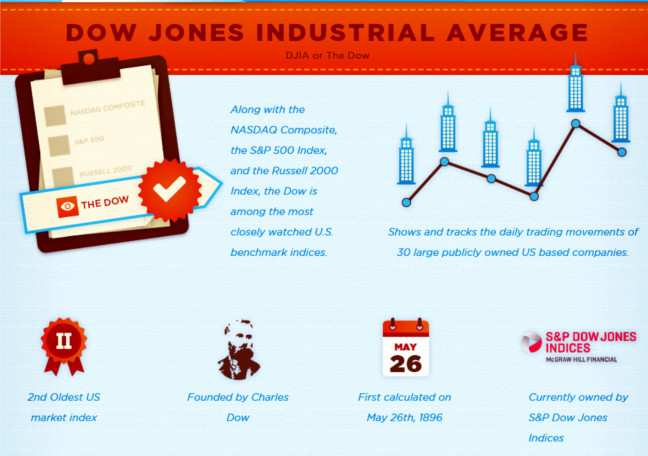
What’s the Difference Between the Dow, S&P 500, and Nasdaq? When stock market pundits talk about market outlook and performance, they’ll often look to the movement...


 Creator Program