

It’s been a long year since the WHO declared the novel coronavirus a global pandemic. This visual looks at key events in the COVID-19 timeline.
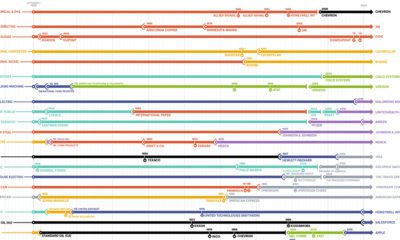

The Dow Jones Industrial Average is constantly evolving. This chart tracks which companies have come and gone since the inception of the index in 1928.
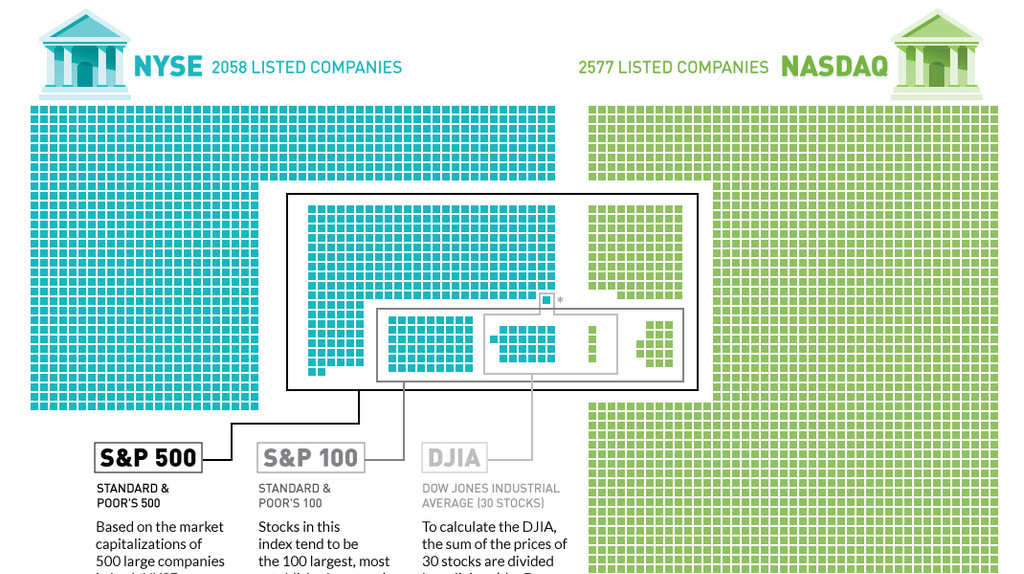
Plotting the 4,500+ companies on the NYSE and NASDAQ to show how the S&P 500, S&P 100, and Dow are derived.


