

The majority of U.S. households saw debts rise in 2020. This data looks at the growth in household debt and the existing debt pile, by generation
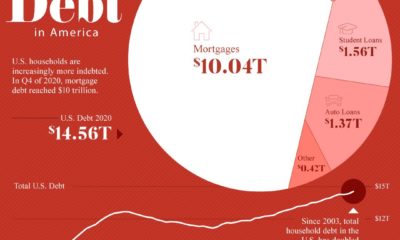

Since 2003, U.S. household debt has doubled to over $14.5 trillion. We break down the components of this colossal figure.
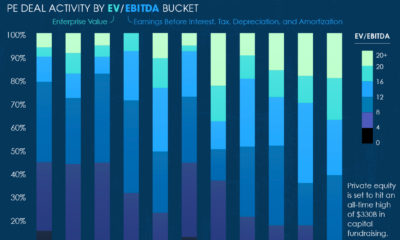

The last decade has witnessed an avalanche of investor capital gravitating towards private equity, along with much richer deal valuations.
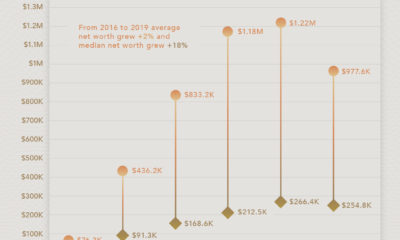

How much is the average American worth at different ages? This chart reveals the average net worth by age in the U.S.
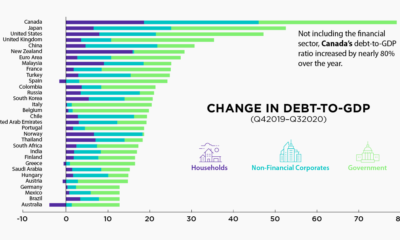

The battle against the COVID-19 pandemic has resulted in heightened debt-to-GDP levels across all sectors and countries.
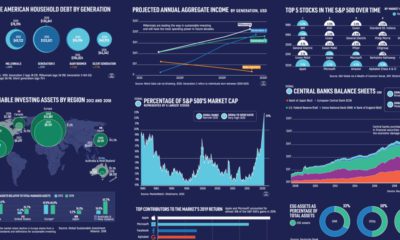

What forces will drive the future of financial markets? We reveal 15 charts from six chapters of our new book to show where the economy is...
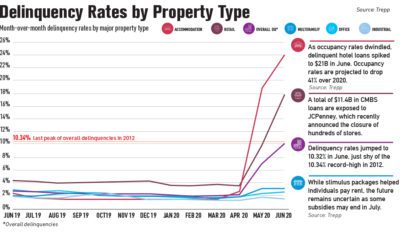

After the 2009 crisis, it took nearly 3 years for commercial mortgage delinquencies to hit record levels. In 2020, it took just 3 months.
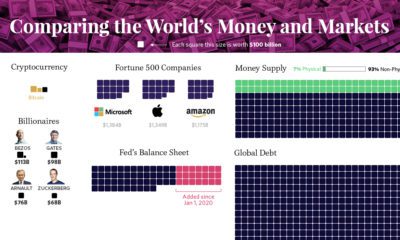

Our most famous visualization, updated for 2020 to show all global debt, wealth, money, and assets in one massive and mind-bending chart.
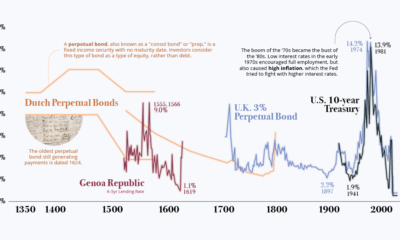

Interest rates sit near generational lows — is this the new normal, or has it been the trend all along? We show a history of interest...


What share of government world debt does each country owe? See it all broken down in this stunning visualization.


