

Today’s stunning map ranks the world’s most powerful megaregions — together, they contribute a whopping $28 trillion to the global economy.
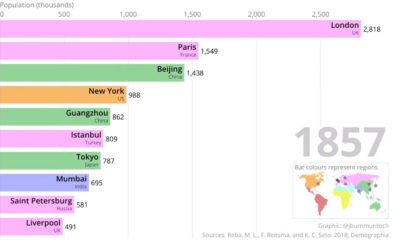

This two-minute animation shows changes in the last 500 years of historical rankings for the world's 10 most populous cities.
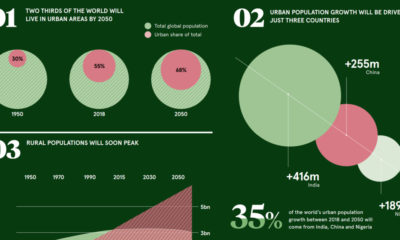

These pivotal trends show how urban demographics are aiding in the transition to a very different economic and investment landscape.
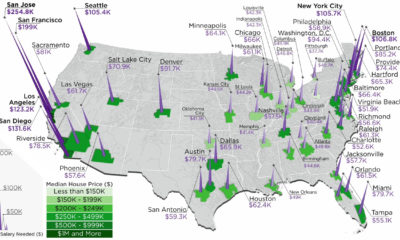

The annual salary needed to buy a home in the U.S. ranges from $38k to $255k, depending on the metropolitan area you are looking in.

By 2050, there will be 2.5 billion more people living in cities than today. How is rapid urbanization set to impact investors and the global economy?v
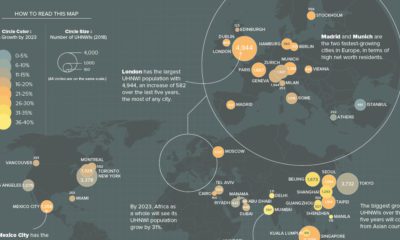

What cities are the world's ultra-rich flocking to? This map looks at ultra high net worth individual (UHNWI) growth rates in cities around the world.
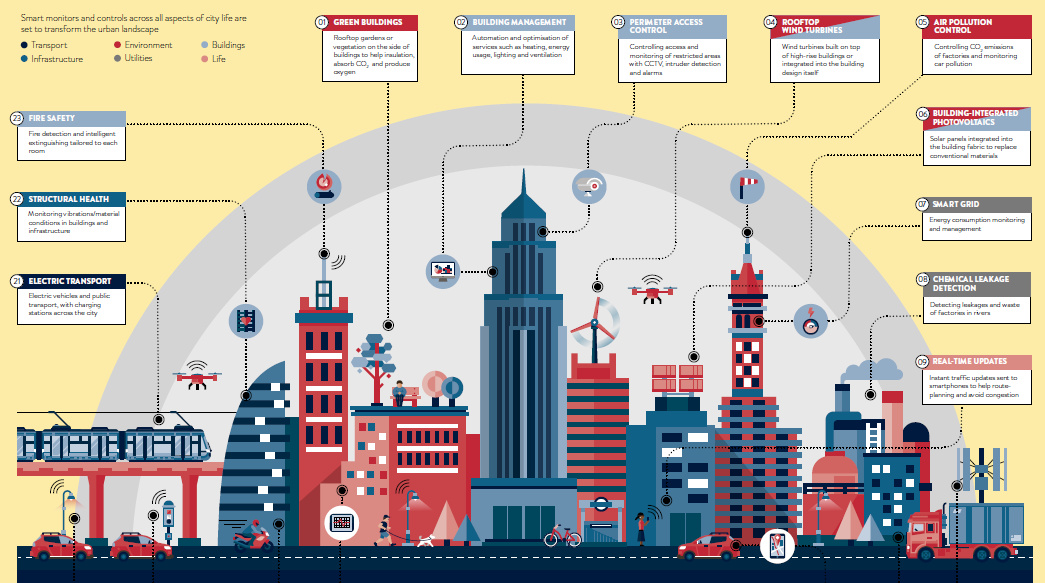
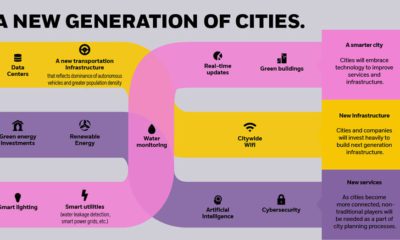
The city will remain the centerpiece of economic growth in the 21st century. Here's how we're using smart city technology to optimize them even further.
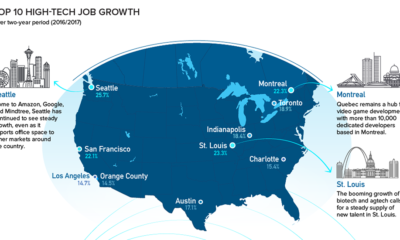

Silicon Valley is no longer the only place to be for a career in tech. Here are the fastest growing tech markets across North America, and...
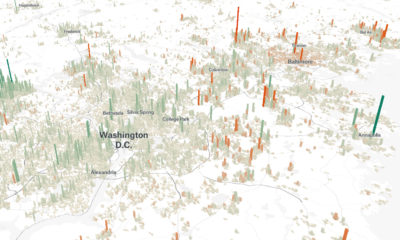

Cities are constantly evolving over time. These 3d graphics visualize both growth and decline with a focus on North American cities from 1990-2015.
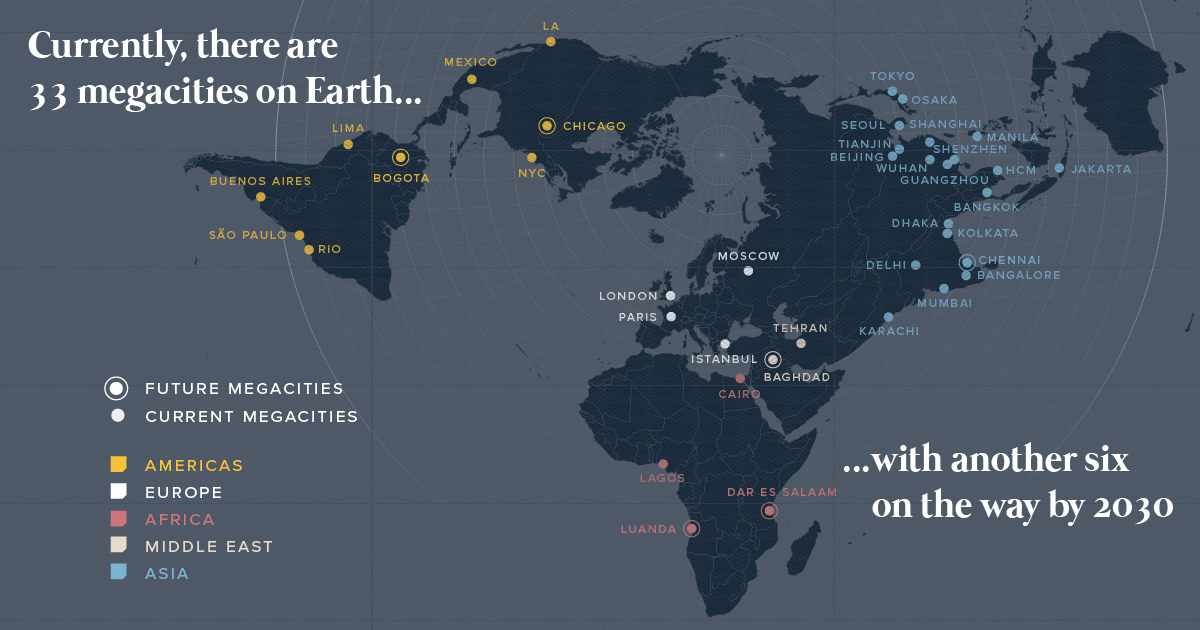
There are currently 33 megacities in the world with over 10 million inhabitants - but by 2030, there will be six new megacities, including one in...


