

We visualized the top U.S. companies by employees, revealing the massive scale of retailers like Walmart, Target, and Home Depot.


We compare America's top 10 companies by revenue in 1994 and 2023 to see how the business landscape has changed.
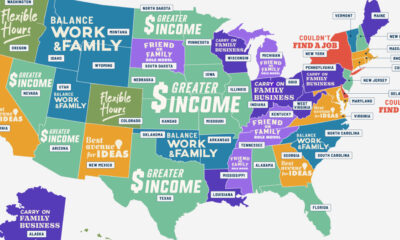

Is it for greater flexibility, more income, or something else? These graphics answer the question, why do people start businesses?
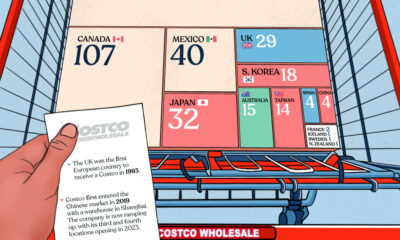

This graphic breaks down the number of Costco stores globally, providing insight into the retailer's global presence.
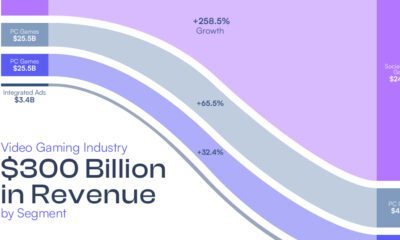

The video games industry could generate over $300 billion by 2026. Here is a break down of that revenue by source.
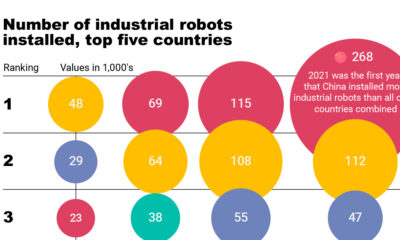

This graphic from MSCI shows the pace of industrial automation across leading countries like China and the U.S.
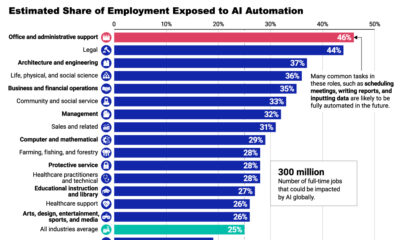

AI automation is expected to impact some industries more than others. See the latest projections in this infographic.


Which companies prioritize innovation the most? This infographic highlights BCG's 2023 Most Innovative Companies ranking.
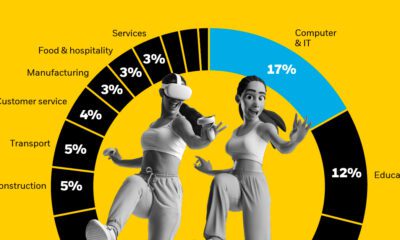

The metaverse could impact over 80% of commerce by 2030 and potentially contribute $5 trillion to the global economy.


This infographic compares Tesla's impressive profit margins to various Western and Chinese competitors.


 Creator Program