Markets
Survey Results: What Do Millennials Want in a Home?
When it comes to buying a home, it’s safe to say that many millennials are caught in a catch-22.
Even though more millennials associate buying a home with the “American Dream” than any other generation, the homeownership rate for Americans under age 35 is near record lows at just 34.7%. In other words, millennials seem to want to buy homes, but various factors have been preventing them in doing so.
Waiting until later in life to start families is one commonly-cited aspect of the story, but millennials are also saddled with student debt and low wages, which have prevented from from amassing any significant savings.
Despite these factors, the demographic evidence is compelling – and many experts are expecting a shift in millennial buying behavior in the coming years.
What Millennials Want in a Home
As the real estate sector becomes more focused on millennials, the market is keying in on an important question: what do millennials want in a home?
Today’s infographic from Northshore Fireplace has an interesting methodology to help us get started in thinking about this question. In late 2016, they commissioned a unique study on 1,000 millennials, representative of all 50 states, in which respondents played a hypothetical game.
Each prospective buyer was put in the following situation: they are starting with an average American home (20+ years old, three bedrooms, and two baths), but have a $300,000 budget to choose between 38 hypothetical property upgrades to get them closer to the home of their dreams.
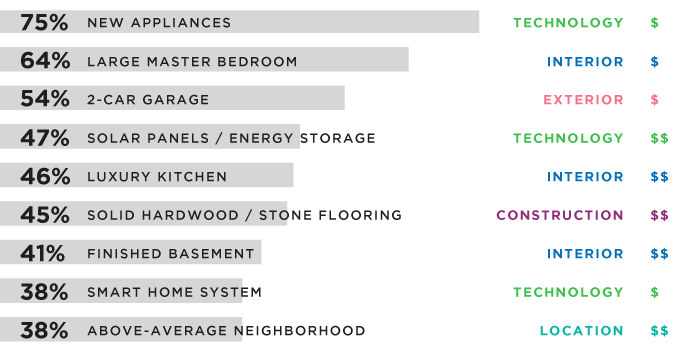
Here is how millennials chose to spend those budgets:

The results are fascinating, and provide an interesting lens with which to think of real estate in the coming millennial era:
- The three most popular upgrades were also in the lowest cost category: new appliances (75%), large master bedroom (64%), and two-car garage (54%)
- The least popular upgrade was an above-ground pool (3%)
- Having solar power and an energy storage system also ranked relatively high at 47%
- Only 24% respondents cared about upgrading to have more land (1+ acres)
- Other popular options: luxury kitchen (46%), solid hardwood/stone flooring (45%), and finished basement (41%)
Study Methodology
First, a baseline was established to represent the average American home. In this case, it was 20+ years old, and came with three bedrooms and two baths, a one car garage, an unfinished basement, and old appliances. All this sits on a quarter-acre lot in an average neighborhood, as part of an average school district. The approximate value of this home is $200,000.
Respondents were given $300,000 of play money to spend, using a hypothetical menu of 38 upgrades with a combined value of $1,000,000. This was represented on the survey by having 20 points to choose from, with each option costing one to three points (depending on how expensive it is).
Northshore Fireplace also rightly noted that real estate is highly subjective – and although in real life these different costs may vary, what is important in this context is how millennials value things within the vacuum of this game.


Markets
U.S. Debt Interest Payments Reach $1 Trillion
U.S. debt interest payments have surged past the $1 trillion dollar mark, amid high interest rates and an ever-expanding debt burden.


U.S. Debt Interest Payments Reach $1 Trillion
This was originally posted on our Voronoi app. Download the app for free on iOS or Android and discover incredible data-driven charts from a variety of trusted sources.
The cost of paying for America’s national debt crossed the $1 trillion dollar mark in 2023, driven by high interest rates and a record $34 trillion mountain of debt.
Over the last decade, U.S. debt interest payments have more than doubled amid vast government spending during the pandemic crisis. As debt payments continue to soar, the Congressional Budget Office (CBO) reported that debt servicing costs surpassed defense spending for the first time ever this year.
This graphic shows the sharp rise in U.S. debt payments, based on data from the Federal Reserve.
A $1 Trillion Interest Bill, and Growing
Below, we show how U.S. debt interest payments have risen at a faster pace than at another time in modern history:
| Date | Interest Payments | U.S. National Debt |
|---|---|---|
| 2023 | $1.0T | $34.0T |
| 2022 | $830B | $31.4T |
| 2021 | $612B | $29.6T |
| 2020 | $518B | $27.7T |
| 2019 | $564B | $23.2T |
| 2018 | $571B | $22.0T |
| 2017 | $493B | $20.5T |
| 2016 | $460B | $20.0T |
| 2015 | $435B | $18.9T |
| 2014 | $442B | $18.1T |
| 2013 | $425B | $17.2T |
| 2012 | $417B | $16.4T |
| 2011 | $433B | $15.2T |
| 2010 | $400B | $14.0T |
| 2009 | $354B | $12.3T |
| 2008 | $380B | $10.7T |
| 2007 | $414B | $9.2T |
| 2006 | $387B | $8.7T |
| 2005 | $355B | $8.2T |
| 2004 | $318B | $7.6T |
| 2003 | $294B | $7.0T |
| 2002 | $298B | $6.4T |
| 2001 | $318B | $5.9T |
| 2000 | $353B | $5.7T |
| 1999 | $353B | $5.8T |
| 1998 | $360B | $5.6T |
| 1997 | $368B | $5.5T |
| 1996 | $362B | $5.3T |
| 1995 | $357B | $5.0T |
| 1994 | $334B | $4.8T |
| 1993 | $311B | $4.5T |
| 1992 | $306B | $4.2T |
| 1991 | $308B | $3.8T |
| 1990 | $298B | $3.4T |
| 1989 | $275B | $3.0T |
| 1988 | $254B | $2.7T |
| 1987 | $240B | $2.4T |
| 1986 | $225B | $2.2T |
| 1985 | $219B | $1.9T |
| 1984 | $205B | $1.7T |
| 1983 | $176B | $1.4T |
| 1982 | $157B | $1.2T |
| 1981 | $142B | $1.0T |
| 1980 | $113B | $930.2B |
| 1979 | $96B | $845.1B |
| 1978 | $84B | $789.2B |
| 1977 | $69B | $718.9B |
| 1976 | $61B | $653.5B |
| 1975 | $55B | $576.6B |
| 1974 | $50B | $492.7B |
| 1973 | $45B | $469.1B |
| 1972 | $39B | $448.5B |
| 1971 | $36B | $424.1B |
| 1970 | $35B | $389.2B |
| 1969 | $30B | $368.2B |
| 1968 | $25B | $358.0B |
| 1967 | $23B | $344.7B |
| 1966 | $21B | $329.3B |
Interest payments represent seasonally adjusted annual rate at the end of Q4.
At current rates, the U.S. national debt is growing by a remarkable $1 trillion about every 100 days, equal to roughly $3.6 trillion per year.
As the national debt has ballooned, debt payments even exceeded Medicaid outlays in 2023—one of the government’s largest expenditures. On average, the U.S. spent more than $2 billion per day on interest costs last year. Going further, the U.S. government is projected to spend a historic $12.4 trillion on interest payments over the next decade, averaging about $37,100 per American.
Exacerbating matters is that the U.S. is running a steep deficit, which stood at $1.1 trillion for the first six months of fiscal 2024. This has accelerated due to the 43% increase in debt servicing costs along with a $31 billion dollar increase in defense spending from a year earlier. Additionally, a $30 billion increase in funding for the Federal Deposit Insurance Corporation in light of the regional banking crisis last year was a major contributor to the deficit increase.
Overall, the CBO forecasts that roughly 75% of the federal deficit’s increase will be due to interest costs by 2034.

-

 Green1 week ago
Ranked: The Countries With the Most Air Pollution in 2023
-

 Automotive2 weeks ago
Almost Every EV Stock is Down After Q1 2024
-

 AI2 weeks ago
The Stock Performance of U.S. Chipmakers So Far in 2024
-

 Markets2 weeks ago
Charted: Big Four Market Share by S&P 500 Audits
-

 Real Estate2 weeks ago
Ranked: The Most Valuable Housing Markets in America
-

 Money2 weeks ago
Which States Have the Highest Minimum Wage in America?
-

 AI2 weeks ago
Ranked: Semiconductor Companies by Industry Revenue Share
-

 Travel2 weeks ago
Ranked: The World’s Top Flight Routes, by Revenue