Misc
Sizing Up the Tallest Skyscraper of 2015
Sizing Up the Tallest Skyscraper of 2015
There were more skyscrapers built in 2015 than any other past year, according to the 2015 Year in Review report created by Skyscraper Central.
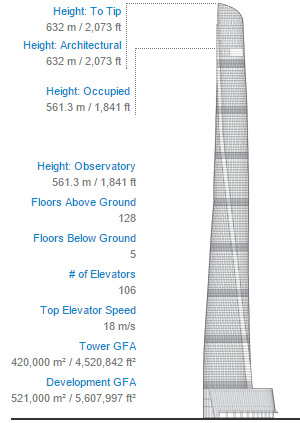
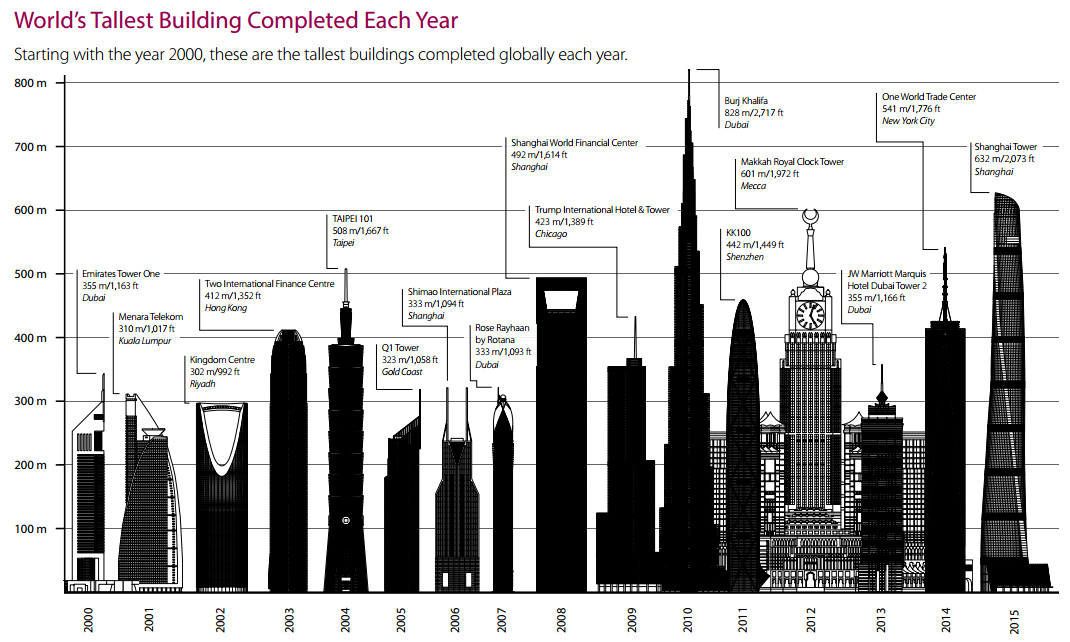
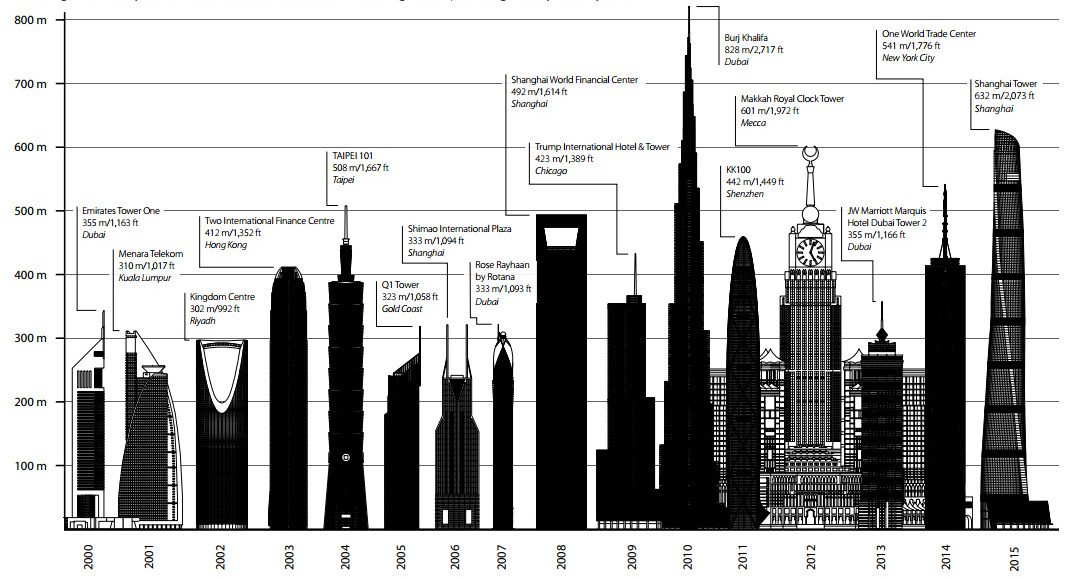
This year’s tallest skyscraper, the Shanghai Tower, comes in at a staggering 2,073 ft (632m) to make it the second tallest building in existence behind Dubai’s iconic Burj Khalifa.
The Shanghai Tower also does a great job at epitomizing current trends in the sector. It’s a multi-use structure (hotel, office) that is made of composite material (steel, concrete).
The second tallest building completed during the year, 432 Park Avenue in New York City, does not come close to challenging the Shanghai Tower in height – it’s shorter by a whopping 677 ft (206m), which is more than two football fields stacked vertically.
In fact, aside from 432 Park Avenue, only two skyscrapers were completed in North America last year: ICE Condominiums at York Centre (Toronto) and Sky (New York City).
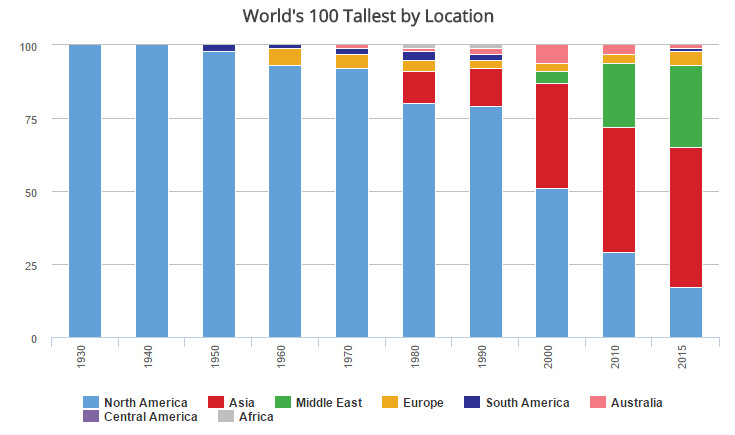
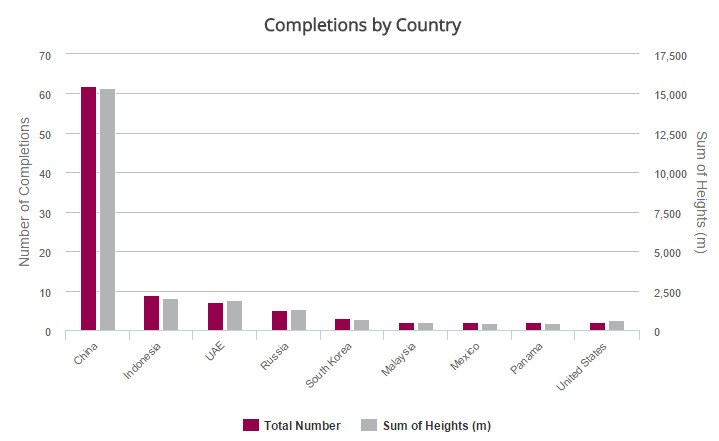
The trend continues to point Asia’s direction, where 76.4% of all skyscrapers completed in 2015 were built.
Here is how the location of the world’s top 100 skyscrapers have changed over time:
The Tallest Skyscrapers of 2015
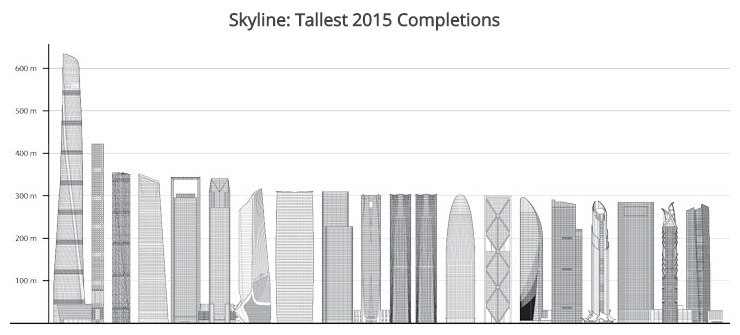
To demonstrate the height of the Shanghai Tower, here it is visualized within the context of the world’s top 20 skyscrapers completed in 2015 by height:
| Rank | Building Name | City | Stories | m | ft |
|---|---|---|---|---|---|
| 1 | Shanghai Tower | Shanghai, China | 128 | 632 | 2073 |
| 2 | 432 Park Avenue | New York City, US | 85 | 426 | 1396 |
| 3 | OKO - Residential Tower | Moscow, Russia | 90 | 354 | 1160 |
| 4 | Forum 66 Tower 1 | Shenyang, China | 68 | 351 | 1150 |
| 5 | ADNOC Headquarters | Abu Dhabi, UAE | 76 | 342 | 1122 |
| 6 | Chongqing World Financial Center | Chongqing, China | 72 | 339 | 1112 |
| 7 | Nanjing International Youth Cultural Centre Tower 1 | Nanjing, China | 68 | 315 | 1032 |
| 8 | Fortune Center | Guangzhou, China | 68 | 309 | 1015 |
| 9 | Stalnaya Vershina | Moscow, Russia | 72 | 309 | 1013 |
| 10 | Diwang International Fortune Center | Liuzhou, China | 75 | 303 | 994 |
| 10 | Jiangxi Nanchang Greenland Central Plaza 1 | Nanchang, China | 59 | 303 | 994 |
| 10 | Jiangxi Nanchang Greenland Central Plaza 2 | Nanchang, China | 59 | 303 | 994 |
| 13 | Greenland Puli Center | Jinan, China | 61 | 301 | 988 |
| 14 | Ilham Tower | Kuala Lumpur, Malaysia | 64 | 298 | 978 |
| 15 | Xiamen Shimao Straits Tower B | Xiamen, China | 67 | 295 | 969 |
| 16 | Kaisa Center | Huizhou, China | 66 | 288 | 945 |
| 17 | D1 Tower | Dubai, UAE | 80 | 284 | 932 |
| 18 | City of Lights C1 Tower | Abu Dhabi, UAE | 62 | 282 | 926 |
| 19 | Al Hekma Tower | Dubai, UAE | 64 | 282 | 925 |
| 20 | Eton Place Dalian Tower 2 | Dalian, China | 62 | 279 | 917 |
Lastly, here’s a summary of skyscraper completions by country:


VC+
VC+: Get Our Key Takeaways From the IMF’s World Economic Outlook
A sneak preview of the exclusive VC+ Special Dispatch—your shortcut to understanding IMF’s World Economic Outlook report.

Have you read IMF’s latest World Economic Outlook yet? At a daunting 202 pages, we don’t blame you if it’s still on your to-do list.
But don’t worry, you don’t need to read the whole April release, because we’ve already done the hard work for you.
To save you time and effort, the Visual Capitalist team has compiled a visual analysis of everything you need to know from the report—and our upcoming VC+ Special Dispatch will be available exclusively to VC+ members on Thursday, April 25th.
If you’re not already subscribed to VC+, make sure you sign up now to receive the full analysis of the IMF report, and more (we release similar deep dives every week).
For now, here’s what VC+ members can expect to receive.
Your Shortcut to Understanding IMF’s World Economic Outlook
With long and short-term growth prospects declining for many countries around the world, this Special Dispatch offers a visual analysis of the key figures and takeaways from the IMF’s report including:
- The global decline in economic growth forecasts
- Real GDP growth and inflation forecasts for major nations in 2024
- When interest rate cuts will happen and interest rate forecasts
- How debt-to-GDP ratios have changed since 2000
- And much more!

Get the Full Breakdown in the Next VC+ Special Dispatch
VC+ members will receive the full Special Dispatch on Thursday, April 25th.
Make sure you join VC+ now to receive exclusive charts and the full analysis of key takeaways from IMF’s World Economic Outlook.
Don’t miss out. Become a VC+ member today.
What You Get When You Become a VC+ Member
VC+ is Visual Capitalist’s premium subscription. As a member, you’ll get the following:
- Special Dispatches: Deep dive visual briefings on crucial reports and global trends
- Markets This Month: A snappy summary of the state of the markets and what to look out for
- The Trendline: Weekly curation of the best visualizations from across the globe
- Global Forecast Series: Our flagship annual report that covers everything you need to know related to the economy, markets, geopolitics, and the latest tech trends
- VC+ Archive: Hundreds of previously released VC+ briefings and reports that you’ve been missing out on, all in one dedicated hub
You can get all of the above, and more, by joining VC+ today.

-

 Markets1 week ago
U.S. Debt Interest Payments Reach $1 Trillion
-

 Markets2 weeks ago
Ranked: The Most Valuable Housing Markets in America
-

 Money2 weeks ago
Which States Have the Highest Minimum Wage in America?
-

 AI2 weeks ago
Ranked: Semiconductor Companies by Industry Revenue Share
-

 Markets2 weeks ago
Ranked: The World’s Top Flight Routes, by Revenue
-

 Countries2 weeks ago
Population Projections: The World’s 6 Largest Countries in 2075
-

 Markets2 weeks ago
The Top 10 States by Real GDP Growth in 2023
-

 Money2 weeks ago
The Smallest Gender Wage Gaps in OECD Countries