Energy
The Oil Market is Bigger Than All Metal Markets Combined
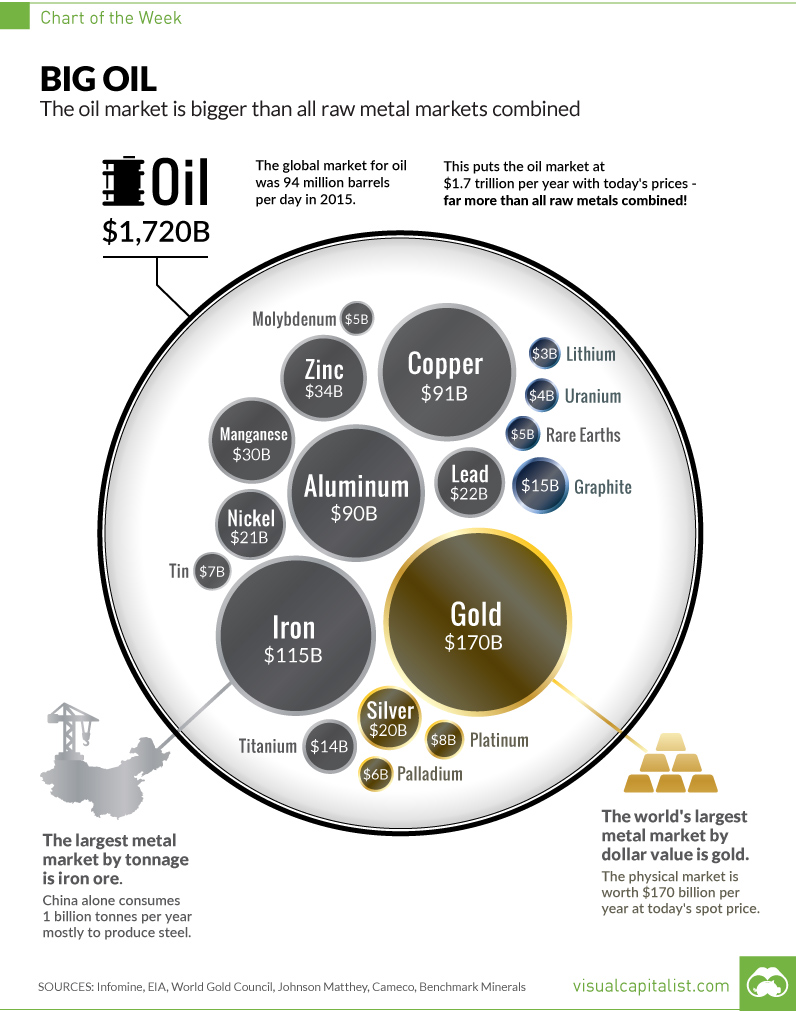
Big Oil
The oil market is bigger than all metal markets combined
The Chart of the Week is a weekly Visual Capitalist feature on Fridays.
Ever since the invention of the internal combustion engine, oil has been one of the most crucial commodities on Earth. Without it, modern transportation as we know it would not be possible. Industries such as aviation, aerospace, automobiles, shipping, and the military would look nothing like they do today.
Of course, as we now know, this has all come with some extreme drawbacks from an environmental perspective. And while new green technology and the lithium revolution will aid in eventually reducing the role of oil in transportation, the fact is we still use 94 million barrels per day of crude worldwide.
As a result, the energy industry continues to have huge amounts of influence on our lives. Special interest groups with a focus on energy have influence on a domestic level. Meanwhile, from a foreign policy angle, countries like Saudi Arabia and Russia wield additional geopolitical and economic power because of their natural resources. It’s even arguable that everything from the Gulf War to the more recent Middle East interventions in Libya, Syria, and Iraq have been at least partially to do with oil.
This week’s chart of the week aims to help explain the influence that oil has on countries and markets by using a very simple perspective: the size of the oil market vs. all metal markets combined.
The True Size of the Oil Market
While the amount of uses in one barrel of oil is quite incredible, we still need a mind-boggling amount of the natural resource each year to sustain consumption.
Oil production per year: 34 billion barrels (incl. other liquids)
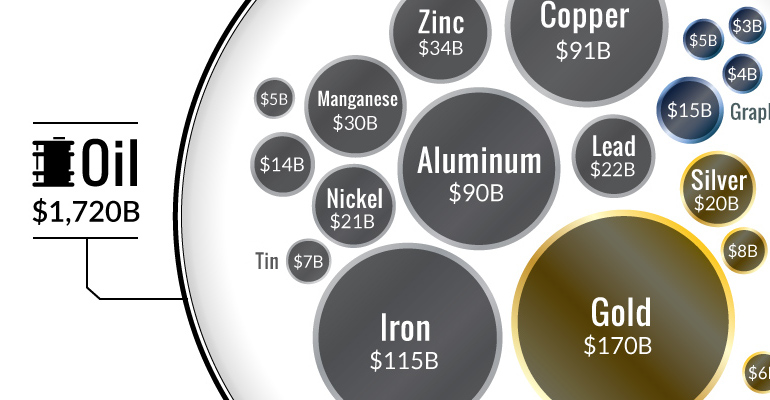
Oil market size at current prices: $1.7 trillion per year
To consider how big this actually is, we compare the annual market sizes of all major metals and minerals that are mined throughout the world:
- Gold: $170 billion
- Iron: $115 billion
- Copper: $91 billion
- Aluminum: $90 billion
- Zinc: $34 billion
- Manganese: $30 billion
- Nickel: $21 billion
- Silver: $20 billion
- Other metals: $67 billion (Including platinum, palladium, titanium, tin, moly, uranium, and more)
The total amount works out to $660 billion – just a tiny fraction of the size of the oil market.
Note: we focus on raw, physical materials in this analysis. We leave out things like gold futures, or alloy markets such as steel in this analysis. To get market size numbers, we used the latest price multiplied by 2015 demand in most cases. We left out the smaller markets for many other metals like bismuth, antimony, or rhodium. Exact sources can be seen in the chart itself. Oil market size includes other liquids such as lease condensate.


Energy
The World’s Biggest Nuclear Energy Producers
China has grown its nuclear capacity over the last decade, now ranking second on the list of top nuclear energy producers.


The World’s Biggest Nuclear Energy Producers
This was originally posted on our Voronoi app. Download the app for free on Apple or Android and discover incredible data-driven charts from a variety of trusted sources.
Scientists in South Korea recently broke a record in a nuclear fusion experiment. For 48 seconds, they sustained a temperature seven times that of the sun’s core.
But generating commercially viable energy from nuclear fusion still remains more science fiction than reality. Meanwhile, its more reliable sibling, nuclear fission, has been powering our world for many decades.
In this graphic, we visualized the top producers of nuclear energy by their share of the global total, measured in terawatt hours (TWh). Data for this was sourced from the Nuclear Energy Institute, last updated in August 2022.
Which Country Generates the Most Nuclear Energy?
Nuclear energy production in the U.S. is more than twice the amount produced by China (ranked second) and France (ranked third) put together. In total, the U.S. accounts for nearly 30% of global nuclear energy output.
However, nuclear power only accounts for one-fifth of America’s electricity supply. This is in contrast to France, which generates 60% of its electricity from nuclear plants.
| Rank | Country | Nuclear Energy Produced (TWh) | % of Total |
|---|---|---|---|
| 1 | 🇺🇸 U.S. | 772 | 29% |
| 2 | 🇨🇳 China | 383 | 14% |
| 3 | 🇫🇷 France | 363 | 14% |
| 4 | 🇷🇺 Russia | 208 | 8% |
| 5 | 🇰🇷 South Korea | 150 | 6% |
| 6 | 🇨🇦 Canada | 87 | 3% |
| 7 | 🇺🇦 Ukraine | 81 | 3% |
| 8 | 🇩🇪 Germany | 65 | 2% |
| 9 | 🇯🇵 Japan | 61 | 2% |
| 10 | 🇪🇸 Spain | 54 | 2% |
| 11 | 🇸🇪 Sweden | 51 | 2% |
| 12 | 🇧🇪 Belgium | 48 | 2% |
| 13 | 🇬🇧 UK | 42 | 2% |
| 14 | 🇮🇳 India | 40 | 2% |
| 15 | 🇨🇿 Czech Republic | 29 | 1% |
| N/A | 🌐 Other | 219 | 8% |
| N/A | 🌍 Total | 2,653 | 100% |
Another highlight is how China has rapidly grown its nuclear energy capabilities in the last decade. Between 2016 and 2021, for example, it increased its share of global nuclear energy output from less than 10% to more than 14%, overtaking France for second place.
On the opposite end, the UK’s share has slipped to 2% over the same time period.
Meanwhile, Ukraine has heavily relied on nuclear energy to power its grid. In March 2022, it lost access to its key Zaporizhzhia Nuclear Power Station after Russian forces wrested control of the facility. With six 1,000 MW reactors, the plant is one of the largest in Europe. It is currently not producing any power, and has been the site of recent drone attacks.

-

 Green2 weeks ago
Ranked: Top Countries by Total Forest Loss Since 2001
-

 Travel1 week ago
Ranked: The World’s Top Flight Routes, by Revenue
-

 Technology1 week ago
Ranked: Semiconductor Companies by Industry Revenue Share
-

 Money2 weeks ago
Which States Have the Highest Minimum Wage in America?
-

 Real Estate2 weeks ago
Ranked: The Most Valuable Housing Markets in America
-

 Markets2 weeks ago
Charted: Big Four Market Share by S&P 500 Audits
-

 AI2 weeks ago
The Stock Performance of U.S. Chipmakers So Far in 2024
-

 Automotive2 weeks ago
Almost Every EV Stock is Down After Q1 2024