Markets
The Shift to a Cashless Society is Snowballing
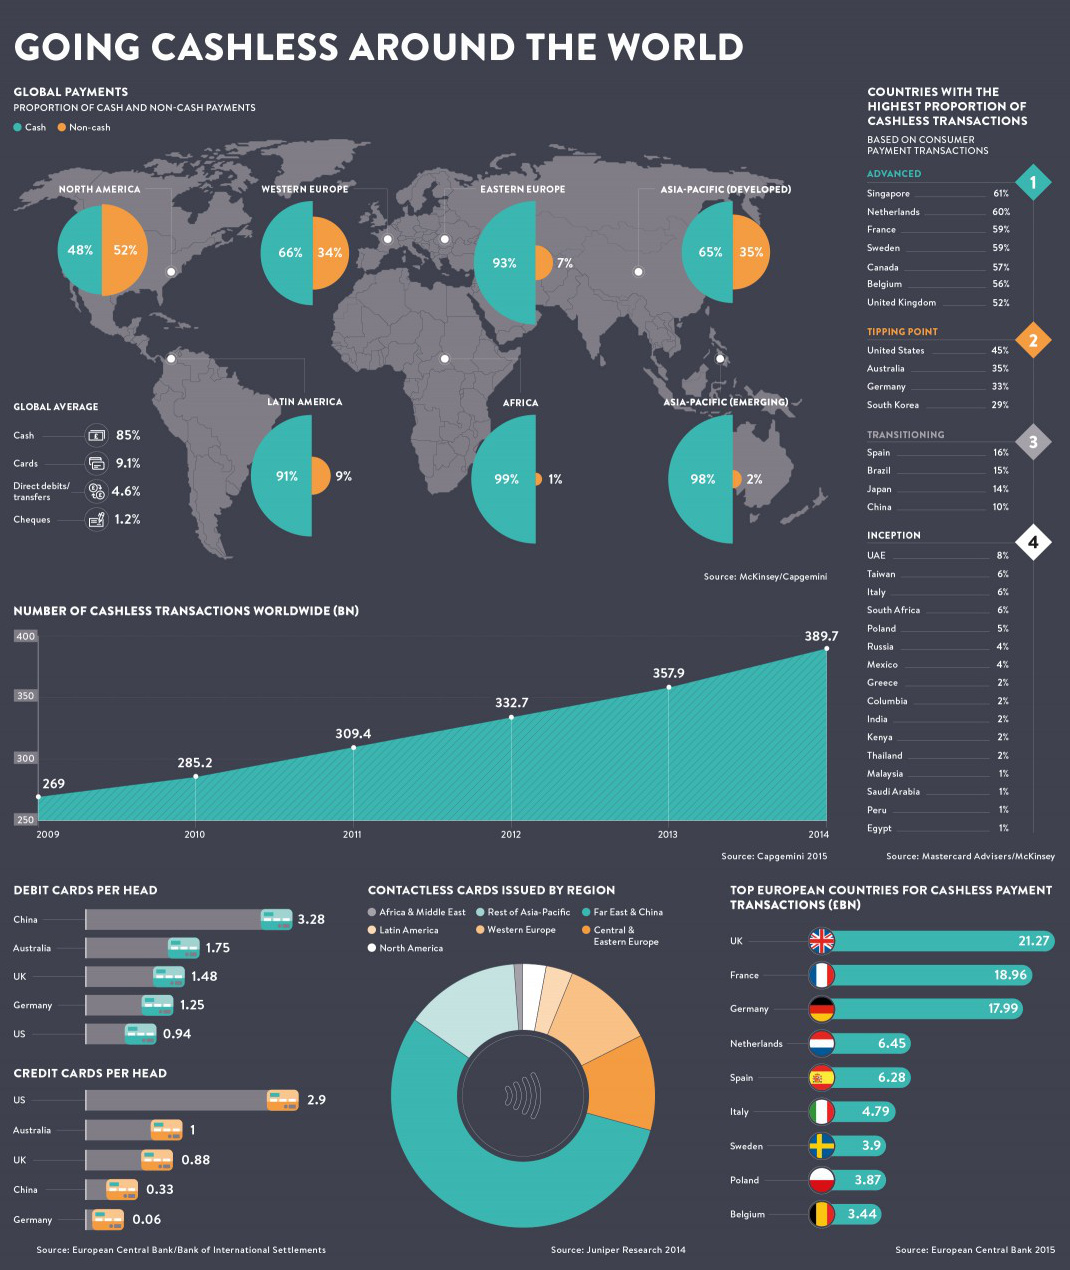
Image courtesy of: Raconteur
The Shift to a Cashless Society is Snowballing
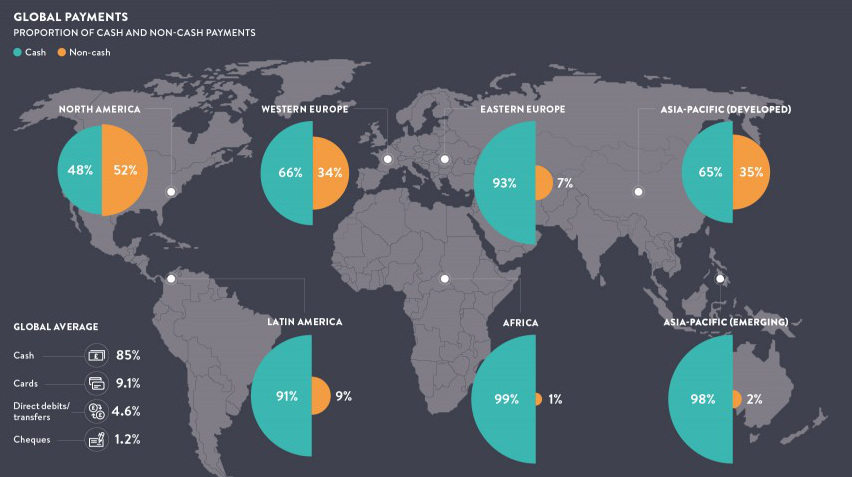
Love it or hate it, cash is playing an increasingly less important role in society.
In some ways this is great news for consumers. The rise of mobile and electronic payments means faster, convenient, and more efficient purchases in most instances. New technologies are being built and improved to facilitate these transactions, and improving security is also a priority for many payment providers.
However, there is also a darker side in the shift to a cashless society. Governments and central banks have a different rationale behind the elimination of cash transactions, and as a result, the so-called “war on cash” is on.
On the Path to a Cashless Society
The Federal Reserve estimates that there will be $616.9 billion in cashless transactions in 2016. That’s up from around $60 billion in 2010.
Despite the magnitude of this overall shift, what is happening from country to country varies quite considerably. Consider the contradicting evidence between Sweden and Germany.
In Sweden, about 59% of all consumer transactions are cashless, and hard currency makes up just 2% of the economy. Yet, across the Baltic Sea, Germans are far bigger proponents of modern cash. This should not be too surprising, considering that the German words for “debt” and “guilt” are the exact same.
Within Germany, only 33% of consumer transactions are cashless, and there are only 0.06 credit cards in existence per person.
The Dark Side of Cashless
The shift to a cashless society is even gaining momentum in Germany, but it is not because of the willing adoption from the general public. According to Handelsblatt, a leading German business newspaper, a proposal to eliminate the €500 note while capping all cash transactions at €5,000 was made in February by the junior partner of the coalition government.
Governments have been increasingly pushing for a cashless society. Ostensibly, by having a paper trail for all transactions, such a move would decrease crime, money laundering, and tax evasion. France’s finance minister recently stated that he would “fight against the use of cash and anonymity in the French economy” in order to prevent terrorism and other threats. Meanwhile, former Secretary of the Treasury and economist Larry Summers has called for scrapping the U.S. $100 bill – the most widely used currency note in the world.
“Smoother” Aggregate Demand?
It’s not simply an argument of the above government rationale versus that of privacy and anonymity. Perhaps the least talked-about implication of a cashless society is the way that it could potentially empower central banking to have more ammunition in “smoothing” out the way people save and spend money.
By eliminating the prospect of cash savings, monetary policy options like negative interest rates would be much more effective if implemented. All money would presumably be stored under the same banking system umbrella, and even the most prudent savers could be taxed with negative rates to encourage consumer spending.
While there are certainly benefits to using digital payments, our view is that going digital should be an individual consumer choice that can be based on personal benefits and drawbacks. People should have the voluntary choice of going plastic or using apps for payment, but they shouldn’t be pushed into either option unwillingly.
Forced banishment of cash is a completely different thing, and we should be increasingly wary and suspicious of the real rationale behind such a scheme.


Markets
U.S. Debt Interest Payments Reach $1 Trillion
U.S. debt interest payments have surged past the $1 trillion dollar mark, amid high interest rates and an ever-expanding debt burden.


U.S. Debt Interest Payments Reach $1 Trillion
This was originally posted on our Voronoi app. Download the app for free on iOS or Android and discover incredible data-driven charts from a variety of trusted sources.
The cost of paying for America’s national debt crossed the $1 trillion dollar mark in 2023, driven by high interest rates and a record $34 trillion mountain of debt.
Over the last decade, U.S. debt interest payments have more than doubled amid vast government spending during the pandemic crisis. As debt payments continue to soar, the Congressional Budget Office (CBO) reported that debt servicing costs surpassed defense spending for the first time ever this year.
This graphic shows the sharp rise in U.S. debt payments, based on data from the Federal Reserve.
A $1 Trillion Interest Bill, and Growing
Below, we show how U.S. debt interest payments have risen at a faster pace than at another time in modern history:
| Date | Interest Payments | U.S. National Debt |
|---|---|---|
| 2023 | $1.0T | $34.0T |
| 2022 | $830B | $31.4T |
| 2021 | $612B | $29.6T |
| 2020 | $518B | $27.7T |
| 2019 | $564B | $23.2T |
| 2018 | $571B | $22.0T |
| 2017 | $493B | $20.5T |
| 2016 | $460B | $20.0T |
| 2015 | $435B | $18.9T |
| 2014 | $442B | $18.1T |
| 2013 | $425B | $17.2T |
| 2012 | $417B | $16.4T |
| 2011 | $433B | $15.2T |
| 2010 | $400B | $14.0T |
| 2009 | $354B | $12.3T |
| 2008 | $380B | $10.7T |
| 2007 | $414B | $9.2T |
| 2006 | $387B | $8.7T |
| 2005 | $355B | $8.2T |
| 2004 | $318B | $7.6T |
| 2003 | $294B | $7.0T |
| 2002 | $298B | $6.4T |
| 2001 | $318B | $5.9T |
| 2000 | $353B | $5.7T |
| 1999 | $353B | $5.8T |
| 1998 | $360B | $5.6T |
| 1997 | $368B | $5.5T |
| 1996 | $362B | $5.3T |
| 1995 | $357B | $5.0T |
| 1994 | $334B | $4.8T |
| 1993 | $311B | $4.5T |
| 1992 | $306B | $4.2T |
| 1991 | $308B | $3.8T |
| 1990 | $298B | $3.4T |
| 1989 | $275B | $3.0T |
| 1988 | $254B | $2.7T |
| 1987 | $240B | $2.4T |
| 1986 | $225B | $2.2T |
| 1985 | $219B | $1.9T |
| 1984 | $205B | $1.7T |
| 1983 | $176B | $1.4T |
| 1982 | $157B | $1.2T |
| 1981 | $142B | $1.0T |
| 1980 | $113B | $930.2B |
| 1979 | $96B | $845.1B |
| 1978 | $84B | $789.2B |
| 1977 | $69B | $718.9B |
| 1976 | $61B | $653.5B |
| 1975 | $55B | $576.6B |
| 1974 | $50B | $492.7B |
| 1973 | $45B | $469.1B |
| 1972 | $39B | $448.5B |
| 1971 | $36B | $424.1B |
| 1970 | $35B | $389.2B |
| 1969 | $30B | $368.2B |
| 1968 | $25B | $358.0B |
| 1967 | $23B | $344.7B |
| 1966 | $21B | $329.3B |
Interest payments represent seasonally adjusted annual rate at the end of Q4.
At current rates, the U.S. national debt is growing by a remarkable $1 trillion about every 100 days, equal to roughly $3.6 trillion per year.
As the national debt has ballooned, debt payments even exceeded Medicaid outlays in 2023—one of the government’s largest expenditures. On average, the U.S. spent more than $2 billion per day on interest costs last year. Going further, the U.S. government is projected to spend a historic $12.4 trillion on interest payments over the next decade, averaging about $37,100 per American.
Exacerbating matters is that the U.S. is running a steep deficit, which stood at $1.1 trillion for the first six months of fiscal 2024. This has accelerated due to the 43% increase in debt servicing costs along with a $31 billion dollar increase in defense spending from a year earlier. Additionally, a $30 billion increase in funding for the Federal Deposit Insurance Corporation in light of the regional banking crisis last year was a major contributor to the deficit increase.
Overall, the CBO forecasts that roughly 75% of the federal deficit’s increase will be due to interest costs by 2034.

-

 Maps2 weeks ago
Mapped: Average Wages Across Europe
-

 Money1 week ago
Which States Have the Highest Minimum Wage in America?
-

 Real Estate1 week ago
Ranked: The Most Valuable Housing Markets in America
-

 Markets1 week ago
Charted: Big Four Market Share by S&P 500 Audits
-

 AI1 week ago
The Stock Performance of U.S. Chipmakers So Far in 2024
-

 Automotive1 week ago
Almost Every EV Stock is Down After Q1 2024
-

 Money2 weeks ago
Where Does One U.S. Tax Dollar Go?
-

 Green2 weeks ago
Ranked: Top Countries by Total Forest Loss Since 2001