Markets
The Salary Needed to Buy a Home in 27 Different U.S. Cities
Check out the latest 2023 update of the salary needed to buy a home in the U.S.
The Salary Needed to Buy a Home in 27 Different U.S. Cities
Check out the latest 2023 update of the salary needed to buy a home in the U.S.
The popping of the Greenspan-era housing bubble took about six years in total to fully “deflate”.
Most U.S. housing markets peaked sometime in 2006, and it wouldn’t be until just before the third-round of quantitative easing in 2012 that this fall would finally be cushioned. Since then, the combination of QE and record-low interest rates have helped re-inflate the housing market. For better or worse, real estate in many U.S. cities are now approaching or passing their 2006 housing highs, but with a growing disparity between individual metropolitan areas.
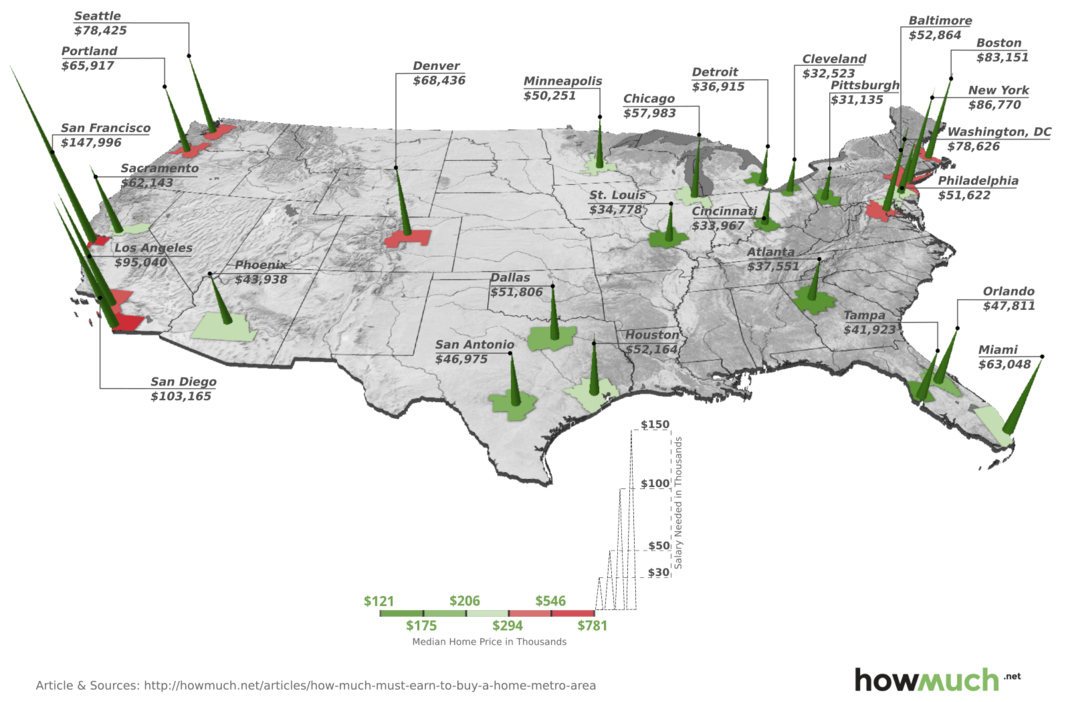
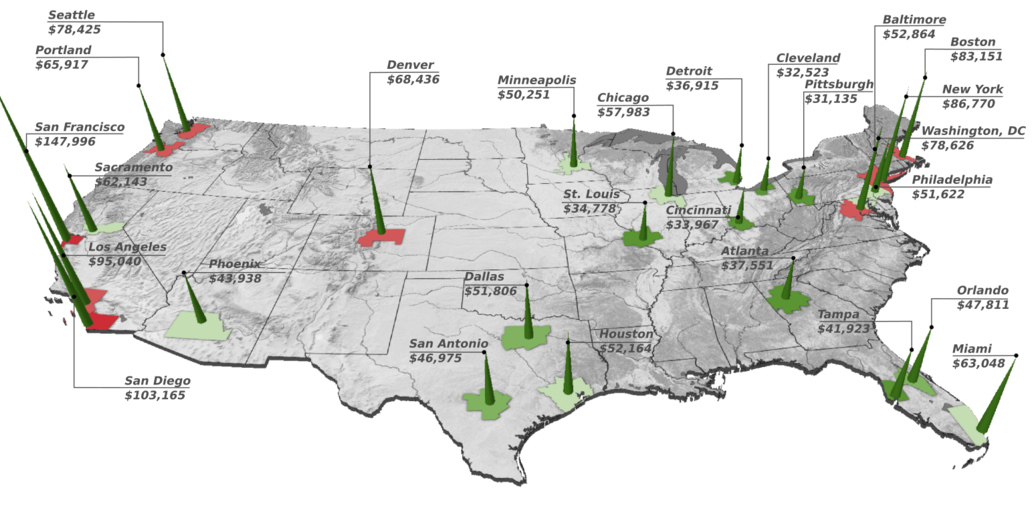
Today’s 3D map comes to us from HowMuch.net, and it shows the very different salaries needed to buy a median home in 27 different U.S. metropolitan areas. The salaries range between $31,134 to $147,996, which is a discrepancy of over $100,000.
At the low end of the spectrum, it takes a salary of between $30,000 to $40,000 to buy a home in most metropolitan areas in the Midwest. In St. Louis, for example, the salary needed to buy a home is $34,778. Pittsburgh was the least expensive city analyzed, where a salary of $31,135 could buy the median house in the city.
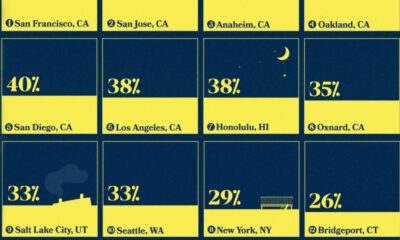
At the high end is any metropolitan area in California, for which closer to six figures is now needed. San Francisco has the most expensive housing in the country, where residents must make $147,996 a year to be an average homeowner. However, Southern California is not far behind the Bay Area, where salaries of $95,040 and $103,165 are required to buy in Los Angeles and San Diego respectively.
See the full data set, including mortgage rates, monthly payments, and median house prices here.
West Coast Envy
Which cities have rebounded the most since the popping of the housing bubble?
According to The Economist’s interactive chart on U.S. housing price indices, the average U.S. market recovery between 2006 peak and 2012 trough has been about 63.9%.
The Eastern half of the country has struggled to rebound to 2006 housing highs, with New York City, Baltimore, Philadelphia, Chicago, Tampa, Miami, and St. Louis all recovering below the above average mark.
In contrast, prices in the West are soaring: San Francisco, Houston, Dallas, Denver, and Portland have all met or exceeded their 2006 highs. Meanwhile, Los Angeles, Seattle, and San Diego have recovered better than average.


Markets
Ranked: The Largest U.S. Corporations by Number of Employees
We visualized the top U.S. companies by employees, revealing the massive scale of retailers like Walmart, Target, and Home Depot.


The Largest U.S. Corporations by Number of Employees
This was originally posted on our Voronoi app. Download the app for free on Apple or Android and discover incredible data-driven charts from a variety of trusted sources.
Revenue and profit are common measures for measuring the size of a business, but what about employee headcount?
To see how big companies have become from a human perspective, we’ve visualized the top U.S. companies by employees. These figures come from companiesmarketcap.com, and were accessed in March 2024. Note that this ranking includes publicly-traded companies only.
Data and Highlights
The data we used to create this list of largest U.S. corporations by number of employees can be found in the table below.
| Company | Sector | Number of Employees |
|---|---|---|
| Walmart | Consumer Staples | 2,100,000 |
| Amazon | Consumer Discretionary | 1,500,000 |
| UPS | Industrials | 500,000 |
| Home Depot | Consumer Discretionary | 470,000 |
| Concentrix | Information Technology | 440,000 |
| Target | Consumer Staples | 440,000 |
| Kroger | Consumer Staples | 430,000 |
| UnitedHealth | Health Care | 400,000 |
| Berkshire Hathaway | Financials | 383,000 |
| Starbucks | Consumer Discretionary | 381,000 |
| Marriott International | Consumer Discretionary | 377,000 |
| Cognizant | Information Technology | 346,600 |
Retail and Logistics Top the List
Companies like Walmart, Target, and Kroger have a massive headcount due to having many locations spread across the country, which require everything from cashiers to IT professionals.
Moving goods around the world is also highly labor intensive, explaining why UPS has half a million employees globally.
Below the Radar?
Two companies that rank among the largest U.S. corporations by employees which may be less familiar to the public include Concentrix and Cognizant. Both of these companies are B2B brands, meaning they primarily work with other companies rather than consumers. This contrasts with brands like Amazon or Home Depot, which are much more visible among average consumers.
A Note on Berkshire Hathaway
Warren Buffett’s company doesn’t directly employ 383,000 people. This headcount actually includes the employees of the firm’s many subsidiaries, such as GEICO (insurance), Dairy Queen (retail), and Duracell (batteries).
If you’re curious to see how Buffett’s empire has grown over the years, check out this animated graphic that visualizes the growth of Berkshire Hathaway’s portfolio from 1994 to 2022.

-

 Business2 weeks ago
America’s Top Companies by Revenue (1994 vs. 2023)
-

 Environment1 week ago
Ranked: Top Countries by Total Forest Loss Since 2001
-

 Markets1 week ago
Visualizing America’s Shortage of Affordable Homes
-

 Maps2 weeks ago
Mapped: Average Wages Across Europe
-

 Mining2 weeks ago
Charted: The Value Gap Between the Gold Price and Gold Miners
-

 Demographics2 weeks ago
Visualizing the Size of the Global Senior Population
-

 Misc2 weeks ago
Tesla Is Once Again the World’s Best-Selling EV Company
-

 Technology2 weeks ago
Ranked: The Most Popular Smartphone Brands in the U.S.