Markets
Chart: The Rise of ETFs and Passive Investing
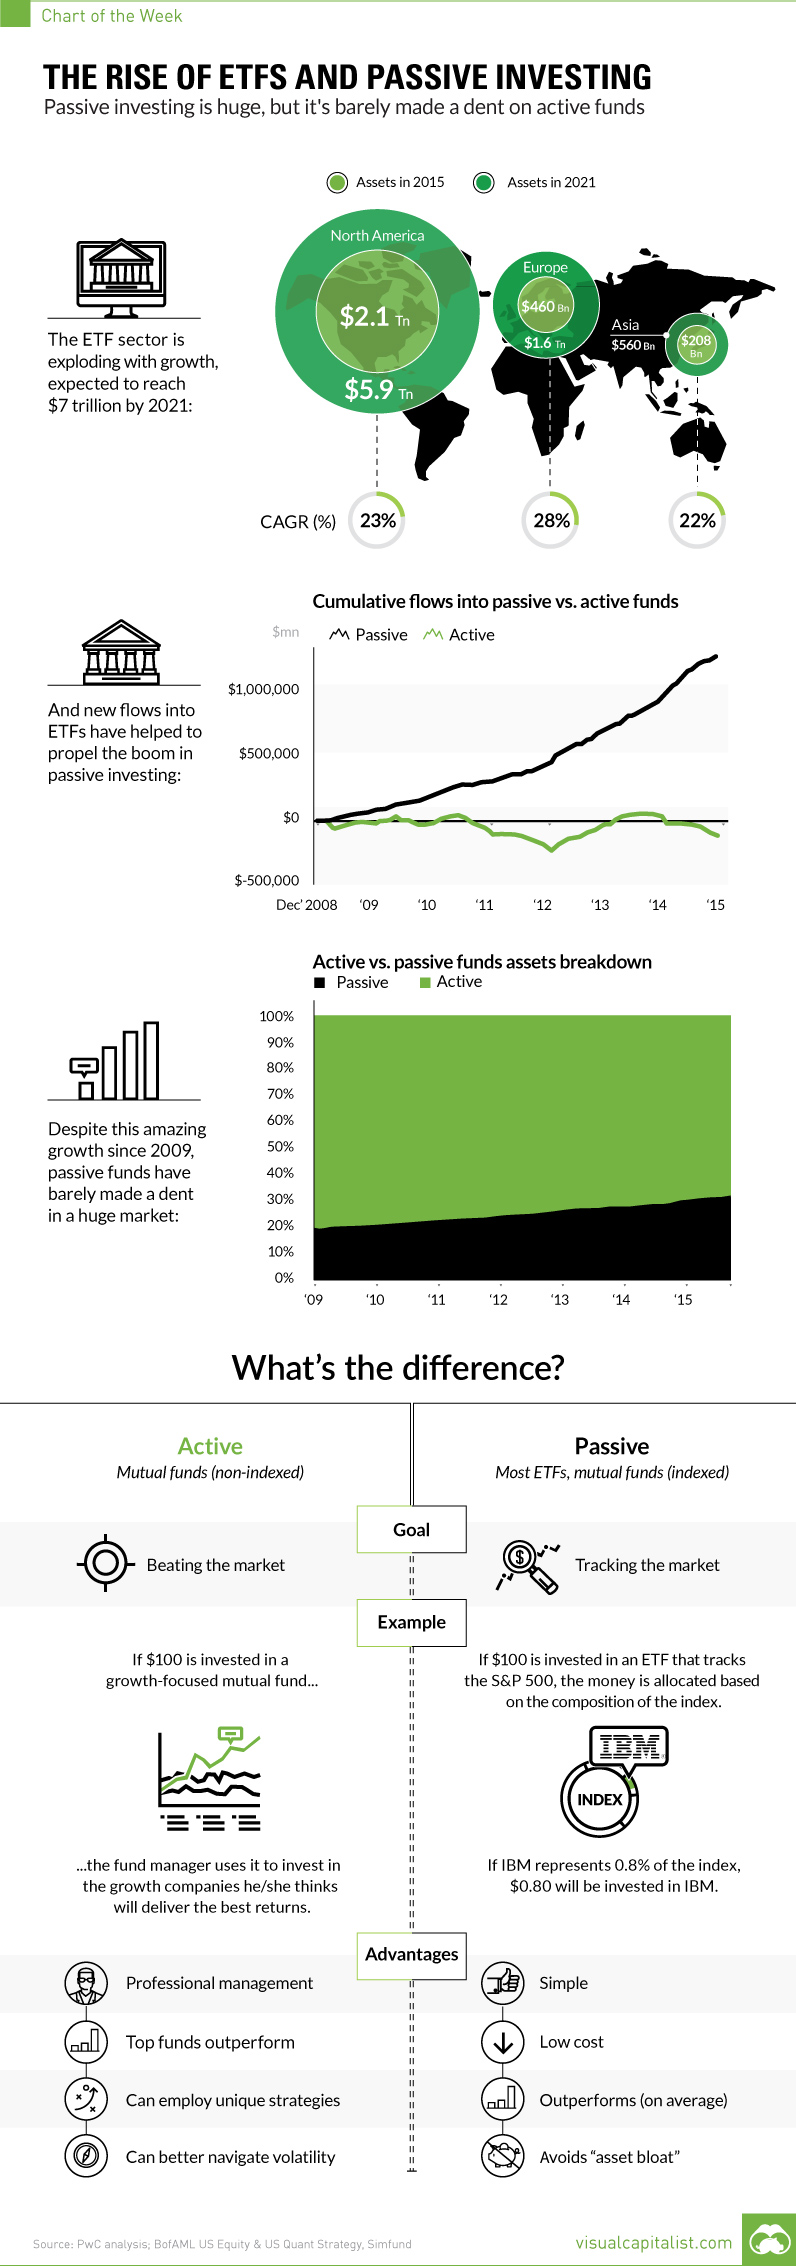
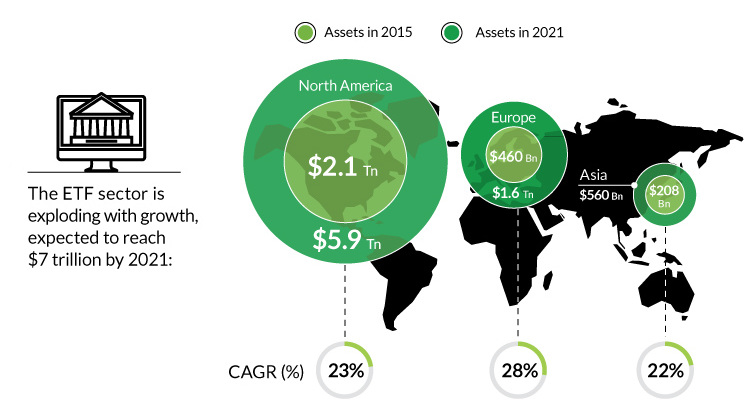
Rise of ETFs and Passive Investing
Passive investing is huge, but it’s barely made a dent on active
The Chart of the Week is a weekly Visual Capitalist feature on Fridays.
For the investing world, the meteoric rise of ETFs, or exchange-traded funds, has been a key story to follow since the 2008 crisis.
The ETF landscape has changed dramatically over that timeframe. In 2007, there were 1,181 ETFs that existed worldwide. By 2015, that number sailed to 4,396 – that’s a lot of new ETFs. Today, there is so much selection out there that you can do pretty much everything.
Want to go 2x short oil? Then try the ProShares UltraShort Bloomberg Crude Oil ETF (SCO). Want to buy into the cybersecurity boom? Try the PureFunds Cybersecurity ETF (HACK). Want to focus in on a specific geographic region such as Singapore? Don’t worry, the iShares MSCI Singapore ETF (EWS) gets you precise exposure to large and mid-sized Singaporean companies.
You get the idea.
Part of a Bigger Trend
Even though the global ETF market is estimated to be worth $7 trillion by 2021, the ETF craze is actually part of a much bigger trend towards putting money into passive funds.
Passive funds aim to “track” a specific market, by allocating dollars in equal proportion to an index. This is in contrast to active funds, which employ professional managers who try to beat the market by having more discretion in choosing which securities make up a portfolio.
The vast majority of ETFs fit in the former category, and passive investing has been on a roll since the Financial Crisis. In 2015, for example, $413.8 billion was poured into passive funds, while $207.3 billion was pulled out of U.S. mutual funds with active management.
Passive or Active?
Why have ETFs and passive investing been so popular? In general, it is because many active managers have struggled to beat the market as a whole in recent years.
However, there are some important caveats worth considering.
First, while most managers fail to beat the market, some of them do succeed. Financial planners will be the first to tell you that there are revered mutual funds out there that do often perform to the upside.
Next, passive funds have also profited off of the extreme and unprecedented actions taken by central banks. Since the crisis, central banks have experimented by pumping trillions of dollars of liquidity into the system, creating a very unusual market situation. With the cost of borrowing at record lows, valuations have become extremely distorted in the market. This careful balancing act by central banks benefits passive investors until it blows up.
Lastly, low volatility by definition means smaller price movements that active managers can capitalize on. If the volatility environment changes, passive funds may lose a level of attractiveness as there are more winners and losers at any given time.


Markets
U.S. Debt Interest Payments Reach $1 Trillion
U.S. debt interest payments have surged past the $1 trillion dollar mark, amid high interest rates and an ever-expanding debt burden.


U.S. Debt Interest Payments Reach $1 Trillion
This was originally posted on our Voronoi app. Download the app for free on iOS or Android and discover incredible data-driven charts from a variety of trusted sources.
The cost of paying for America’s national debt crossed the $1 trillion dollar mark in 2023, driven by high interest rates and a record $34 trillion mountain of debt.
Over the last decade, U.S. debt interest payments have more than doubled amid vast government spending during the pandemic crisis. As debt payments continue to soar, the Congressional Budget Office (CBO) reported that debt servicing costs surpassed defense spending for the first time ever this year.
This graphic shows the sharp rise in U.S. debt payments, based on data from the Federal Reserve.
A $1 Trillion Interest Bill, and Growing
Below, we show how U.S. debt interest payments have risen at a faster pace than at another time in modern history:
| Date | Interest Payments | U.S. National Debt |
|---|---|---|
| 2023 | $1.0T | $34.0T |
| 2022 | $830B | $31.4T |
| 2021 | $612B | $29.6T |
| 2020 | $518B | $27.7T |
| 2019 | $564B | $23.2T |
| 2018 | $571B | $22.0T |
| 2017 | $493B | $20.5T |
| 2016 | $460B | $20.0T |
| 2015 | $435B | $18.9T |
| 2014 | $442B | $18.1T |
| 2013 | $425B | $17.2T |
| 2012 | $417B | $16.4T |
| 2011 | $433B | $15.2T |
| 2010 | $400B | $14.0T |
| 2009 | $354B | $12.3T |
| 2008 | $380B | $10.7T |
| 2007 | $414B | $9.2T |
| 2006 | $387B | $8.7T |
| 2005 | $355B | $8.2T |
| 2004 | $318B | $7.6T |
| 2003 | $294B | $7.0T |
| 2002 | $298B | $6.4T |
| 2001 | $318B | $5.9T |
| 2000 | $353B | $5.7T |
| 1999 | $353B | $5.8T |
| 1998 | $360B | $5.6T |
| 1997 | $368B | $5.5T |
| 1996 | $362B | $5.3T |
| 1995 | $357B | $5.0T |
| 1994 | $334B | $4.8T |
| 1993 | $311B | $4.5T |
| 1992 | $306B | $4.2T |
| 1991 | $308B | $3.8T |
| 1990 | $298B | $3.4T |
| 1989 | $275B | $3.0T |
| 1988 | $254B | $2.7T |
| 1987 | $240B | $2.4T |
| 1986 | $225B | $2.2T |
| 1985 | $219B | $1.9T |
| 1984 | $205B | $1.7T |
| 1983 | $176B | $1.4T |
| 1982 | $157B | $1.2T |
| 1981 | $142B | $1.0T |
| 1980 | $113B | $930.2B |
| 1979 | $96B | $845.1B |
| 1978 | $84B | $789.2B |
| 1977 | $69B | $718.9B |
| 1976 | $61B | $653.5B |
| 1975 | $55B | $576.6B |
| 1974 | $50B | $492.7B |
| 1973 | $45B | $469.1B |
| 1972 | $39B | $448.5B |
| 1971 | $36B | $424.1B |
| 1970 | $35B | $389.2B |
| 1969 | $30B | $368.2B |
| 1968 | $25B | $358.0B |
| 1967 | $23B | $344.7B |
| 1966 | $21B | $329.3B |
Interest payments represent seasonally adjusted annual rate at the end of Q4.
At current rates, the U.S. national debt is growing by a remarkable $1 trillion about every 100 days, equal to roughly $3.6 trillion per year.
As the national debt has ballooned, debt payments even exceeded Medicaid outlays in 2023—one of the government’s largest expenditures. On average, the U.S. spent more than $2 billion per day on interest costs last year. Going further, the U.S. government is projected to spend a historic $12.4 trillion on interest payments over the next decade, averaging about $37,100 per American.
Exacerbating matters is that the U.S. is running a steep deficit, which stood at $1.1 trillion for the first six months of fiscal 2024. This has accelerated due to the 43% increase in debt servicing costs along with a $31 billion dollar increase in defense spending from a year earlier. Additionally, a $30 billion increase in funding for the Federal Deposit Insurance Corporation in light of the regional banking crisis last year was a major contributor to the deficit increase.
Overall, the CBO forecasts that roughly 75% of the federal deficit’s increase will be due to interest costs by 2034.

-

 Mining2 weeks ago
Charted: The Value Gap Between the Gold Price and Gold Miners
-

 Real Estate1 week ago
Ranked: The Most Valuable Housing Markets in America
-

 Business1 week ago
Charted: Big Four Market Share by S&P 500 Audits
-

 AI1 week ago
The Stock Performance of U.S. Chipmakers So Far in 2024
-

 Automotive1 week ago
Almost Every EV Stock is Down After Q1 2024
-

 Money2 weeks ago
Where Does One U.S. Tax Dollar Go?
-

 Green2 weeks ago
Ranked: Top Countries by Total Forest Loss Since 2001
-

 Markets2 weeks ago
Visualizing America’s Shortage of Affordable Homes