Money
The Richest Person on Each Continent
The Richest Person on Each Continent
With a stock price surge of 13% after Amazon’s most recent quarterly filing, Wall Street analysts were reportedly “shocked” by the company’s rapid growth. The e-commerce juggernaut beat both quarterly revenue and earnings forecasts, and continues to trailblaze with a 34% revenue growth rate.
This boded well for the net worth of Amazon founder Jeff Bezos, which fluctuates wildly based on Amazon stock price movements. In fact, the recent jump in price on October 27 helped catapult him past Bill Gates (again) to become the richest person in North America, as well as the entire world.
As of publication time, according to Forbes’ real-time wealth tracker, his wealth stands at $92.6 billion.
Net Worth Leaders by Continent
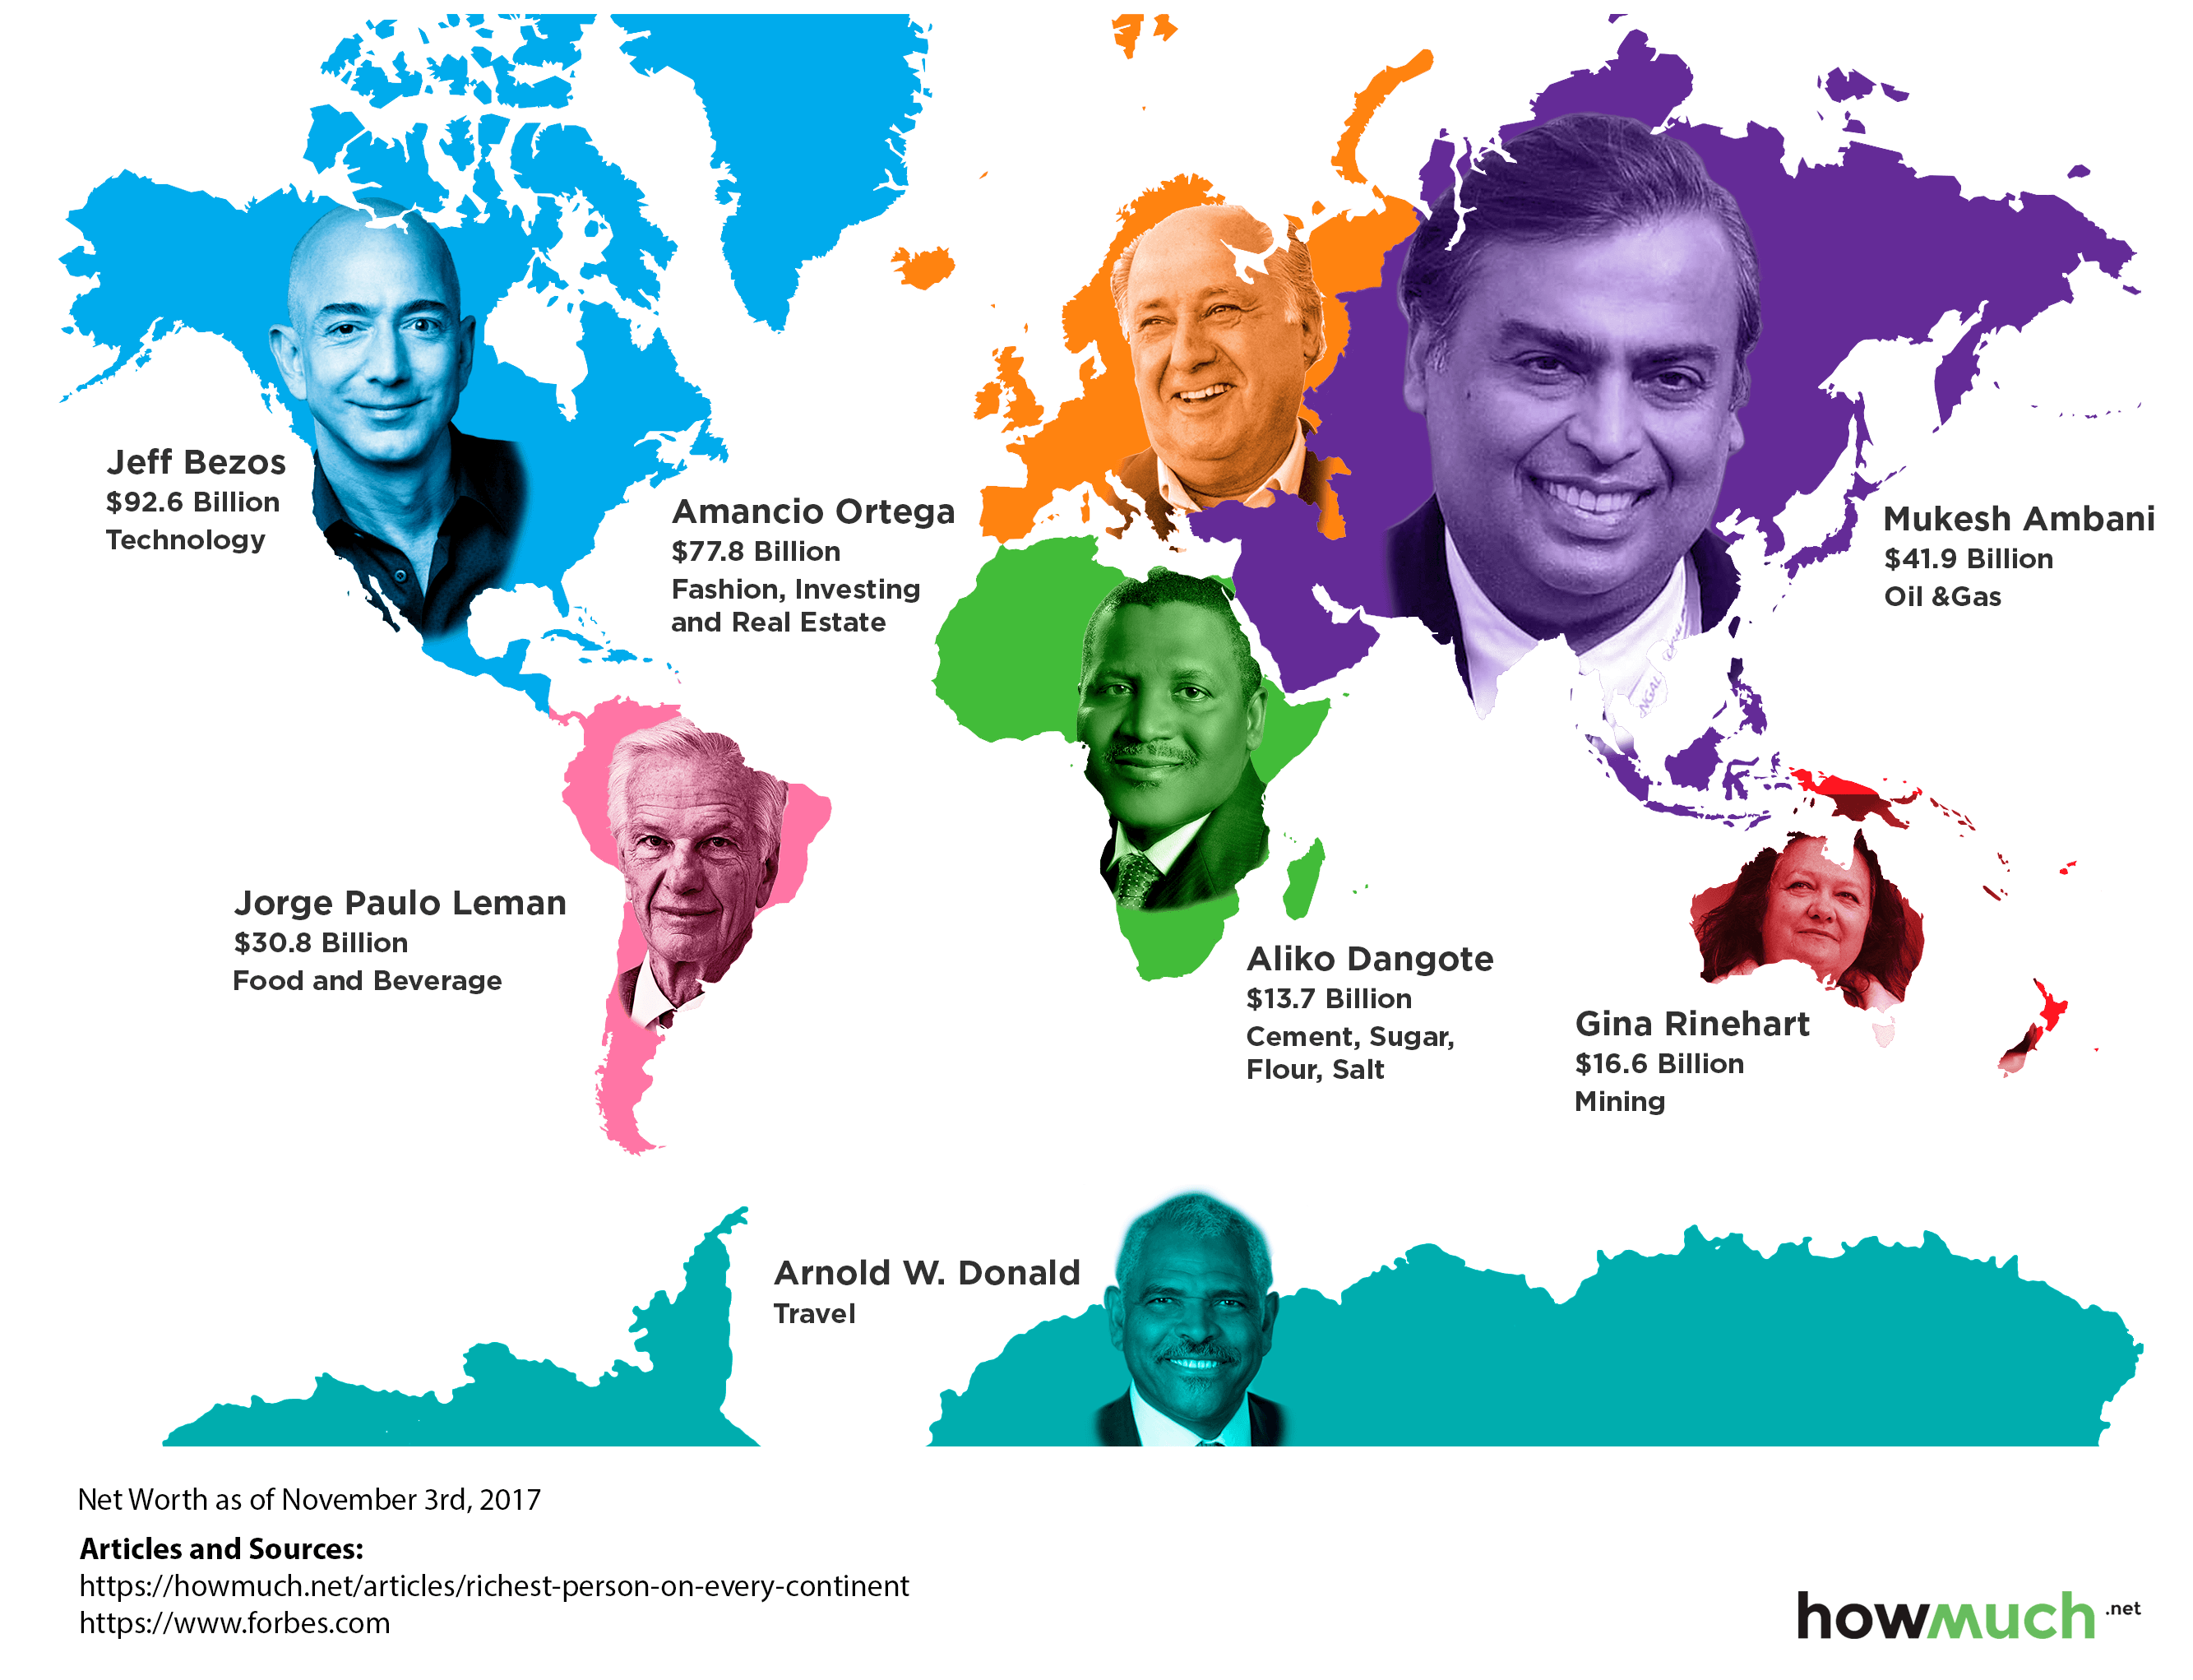
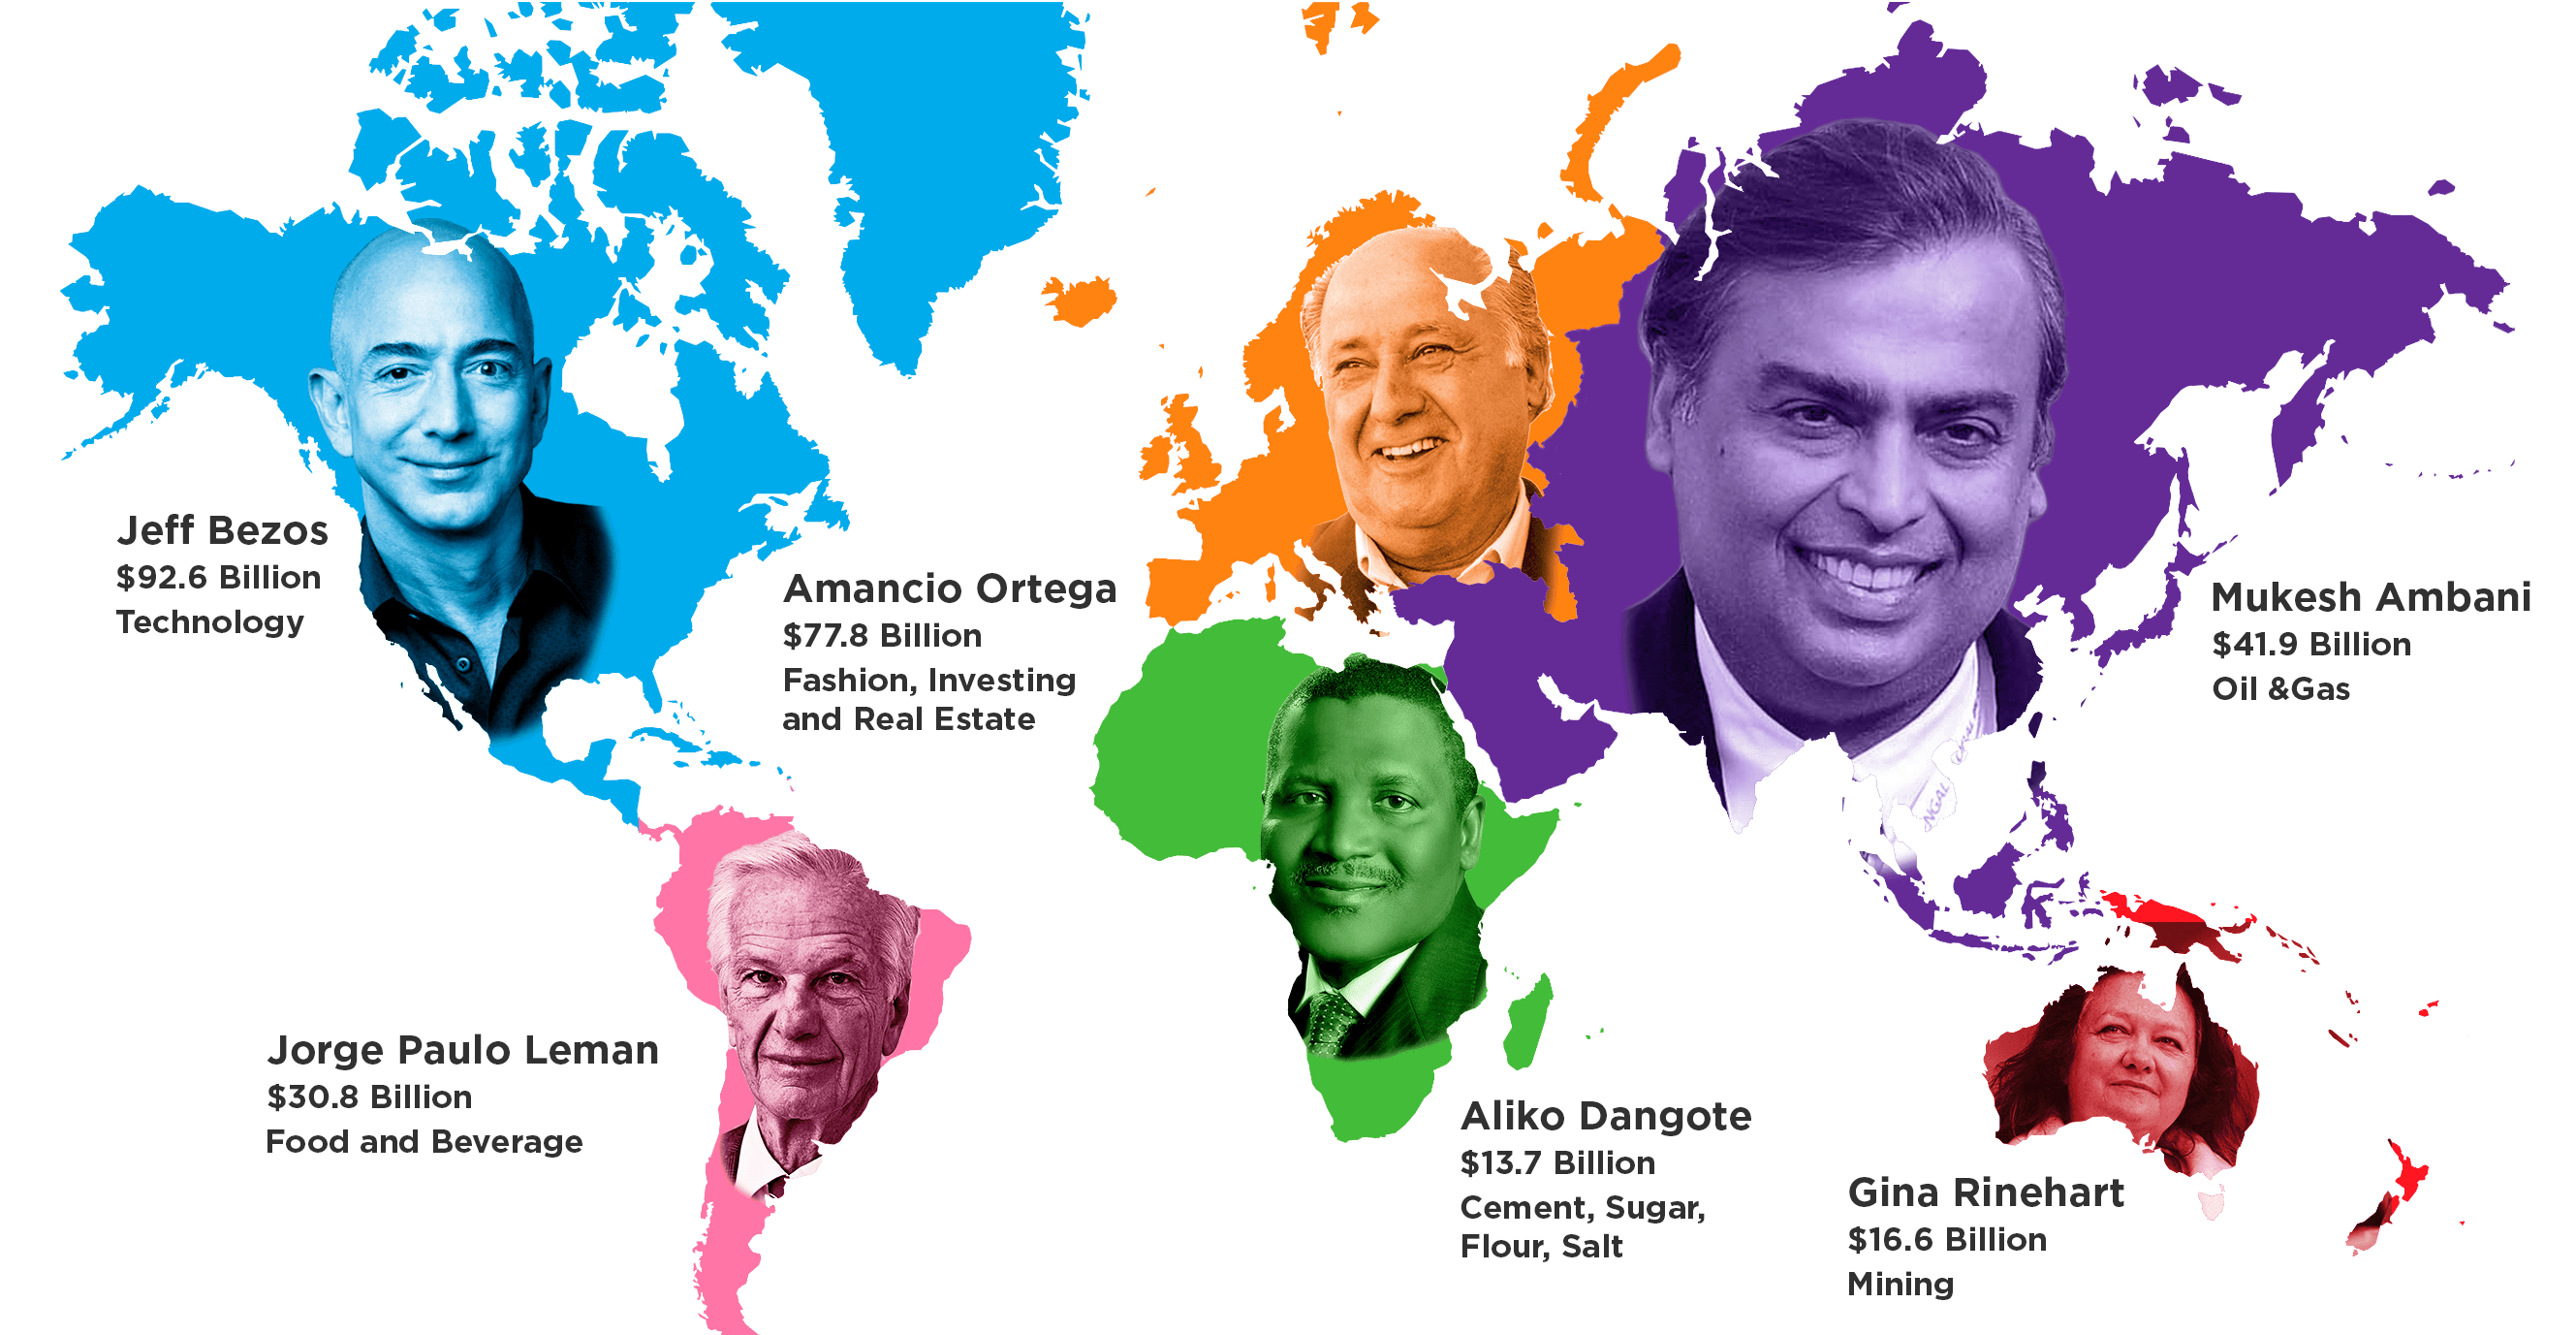
Today’s graphic comes to us from HowMuch.net and it shows the richest person on each continent.
Here is the full breakdown:
| Person | Continent | Net Worth | Source of Wealth |
|---|---|---|---|
| Jeff Bezos | North America | $92.6B | Technology |
| Jorge Paulo Leman | South America | $30.8B | Food and beverage |
| Amancio Ortega | Europe | $77.8B | Fashion, real estate, investing |
| Aliko Dangote | Africa | $13.7B | Cement, sugar, flour, salt |
| Mukesh Ambani | Asia | $41.9B | Oil an gas |
| Gina Rinehart | Oceania | $16.6B | Mining |
Net worth figures from HowMuch.net as of November 3, 2017
To be thorough, HowMuch.net also “nominated” a person to represent the continent of Antarctica, even though it has no permanent residents.
Chosen for this title? It’s none other than Arnold W. Donald, the CEO of Carnival, the world’s largest cruise company, which monetizes the icy continent for its Antarctic cruises on a regular basis.
This graphic has been amended since initial publication. Just yesterday, Mukesh Ambani climbed up the list to become the richest person in Asia, and it now reflects that. Thanks to everyone who pointed this out.


Money
Charted: Who Has Savings in This Economy?
Older, better-educated adults are winning the savings game, reveals a January survey by the National Opinion Research Center at the University of Chicago.


Who Has Savings in This Economy?
This was originally posted on our Voronoi app. Download the app for free on iOS or Android and discover incredible data-driven charts from a variety of trusted sources.
Two full years of inflation have taken their toll on American households. In 2023, the country’s collective credit card debt crossed $1 trillion for the first time. So who is managing to save money in the current economic environment?
We visualize the percentage of respondents to the statement “I have money leftover at the end of the month” categorized by age and education qualifications. Data is sourced from a National Endowment for Financial Education (NEFE) report, published last month.
The survey for NEFE was conducted from January 12-14, 2024, by the National Opinion Research Center at the University of Chicago. It involved 1,222 adults aged 18+ and aimed to be representative of the U.S. population.
Older Americans Save More Than Their Younger Counterparts
General trends from this dataset indicate that as respondents get older, a higher percentage of them are able to save.
| Age | Always/Often | Sometimes | Rarely/Never |
|---|---|---|---|
| 18–29 | 29% | 33% | 38% |
| 30–44 | 36% | 27% | 37% |
| 45–59 | 39% | 23% | 38% |
| Above 60 | 49% | 28% | 23% |
| All Adults | 39% | 33% | 27% |
Note: Percentages are rounded and may not sum to 100.
Perhaps not surprisingly, those aged 60+ are the age group with the highest percentage saying they have leftover money at the end of the month. This age group spent the most time making peak earnings in their careers, are more likely to have investments, and are more likely to have paid off major expenses like a mortgage or raising a family.
The Impact of Higher Education on Earnings and Savings
Based on this survey, higher education dramatically improves one’s ability to save. Shown in the table below, those with a bachelor’s degree or higher are three times more likely to have leftover money than those without a high school diploma.
| Education | Always/Often | Sometimes | Rarely/Never |
|---|---|---|---|
| No HS Diploma | 18% | 26% | 56% |
| HS Diploma | 28% | 33% | 39% |
| Associate Degree | 33% | 31% | 36% |
| Bachelor/Higher Degree | 59% | 21% | 20% |
| All Adults | 39% | 33% | 27% |
Note: Percentages are rounded and may not sum to 100.
As the Bureau of Labor Statistics notes, earnings improve with every level of education completed.
For example, those with a high school diploma made 25% more than those without in 2022. And as the qualifications increase, the effects keep stacking.
Meanwhile, a Federal Reserve study also found that those with more education tended to make financial decisions that contributed to building wealth, of which the first step is to save.

-

 Markets1 week ago
U.S. Debt Interest Payments Reach $1 Trillion
-

 Business2 weeks ago
Charted: Big Four Market Share by S&P 500 Audits
-

 Real Estate2 weeks ago
Ranked: The Most Valuable Housing Markets in America
-

 Money2 weeks ago
Which States Have the Highest Minimum Wage in America?
-

 AI2 weeks ago
Ranked: Semiconductor Companies by Industry Revenue Share
-

 Markets2 weeks ago
Ranked: The World’s Top Flight Routes, by Revenue
-

 Demographics2 weeks ago
Population Projections: The World’s 6 Largest Countries in 2075
-

 Markets2 weeks ago
The Top 10 States by Real GDP Growth in 2023