Personal Finance
The Relationship Between Income and Wealth
Let’s say that your neighbor is a surgeon that makes $250,000 a year. Does that mean he or she is rich?
The answer is “no” – and it turns out that the actual statistical relationship between income and wealth is surprisingly low.
Graphing Income and Wealth
The folks at Don’t Quit Your Day Job did an analysis of federal data on income and net worth, and the results can be summarized with this visualization:
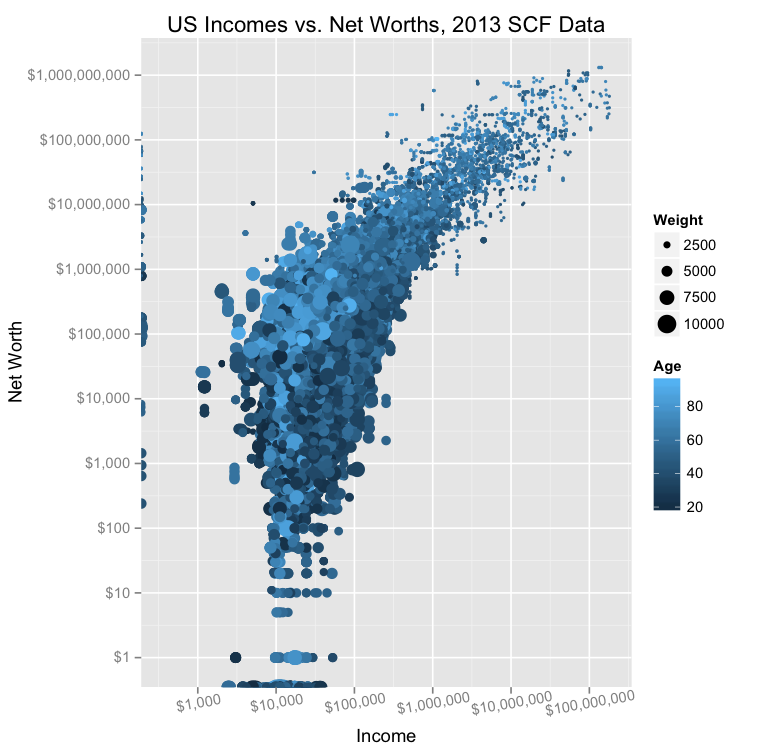
The X axis shows annual income, and the Y axis shows net worth. It’s also worth noting that both scales are logarithmic, so they the intervals increase by a factor of 10x.
The above data has some correlation, but it’s not as much as you’d likely think.
The R-squared value, a measure used to express the relationship between two sets of data, is only 33%. In other words, one variable only helps to “explain” the other about a third of the time, which suggests just a partial relationship between income and net worth.
Although this minimal relationship may seem counterintuitive to some people, it all makes more sense when you consider that income is just one factor that could contribute to overall net worth. Income is important, but spending habits, savings, and investments are also important to building wealth over time.
The Age and Experience Factor
Now, here’s the really interesting part: income is a better predictor for the wealth of people in certain age groups, and a worse predictor for others.
Here’s another chart from DQYDJ:
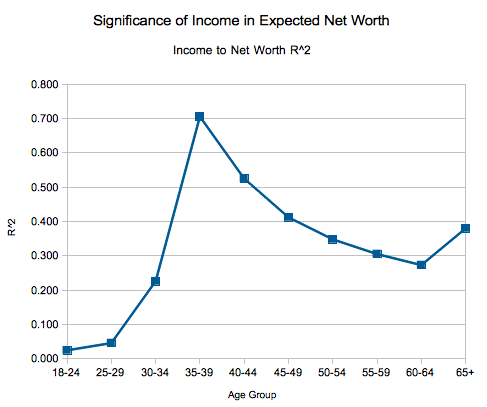
For younger people, there seems to be hardly any relationship between income and wealth. Later on, in the late-30s, the relationship seems to peak. During this age period, income is actually a very good predictor of someone’s net worth.
Finally, from there, the relationship seems to decrease over time. The older you get, the less likely income is a useful predictor of actual wealth.
This makes sense for a variety of reasons, but perhaps one of the more important one is how that money is spent. People that are disciplined savers and smart investors will increase their net worth over time, regardless of their income.


Personal Finance
Chart: The Declining Value of the U.S. Federal Minimum Wage
This graphic compares the nominal vs. inflation-adjusted value of the U.S. minimum wage, from 1940 to 2023.


The Declining Value of the U.S. Federal Minimum Wage
This was originally posted on our Voronoi app. Download the app for free on iOS or Android and discover incredible data-driven charts from a variety of trusted sources.
This graphic illustrates the history of the U.S. federal minimum wage using data compiled by Statista, in both nominal and real (inflation-adjusted) terms. The federal minimum wage was raised to $7.25 per hour in July 2009, where it has remained ever since.
Nominal vs. Real Value
The data we used to create this graphic can be found in the table below.
| Year | Nominal value ($/hour) | Real value ($/hour) |
|---|---|---|
| 1940 | 0.3 | 6.5 |
| 1945 | 0.4 | 6.82 |
| 1950 | 0.75 | 9.64 |
| 1955 | 0.75 | 8.52 |
| 1960 | 1 | 10.28 |
| 1965 | 1.25 | 12.08 |
| 1970 | 1.6 | 12.61 |
| 1975 | 2.1 | 12.04 |
| 1980 | 3.1 | 11.61 |
| 1985 | 3.35 | 9.51 |
| 1990 | 3.8 | 8.94 |
| 1995 | 4.25 | 8.49 |
| 2000 | 5.15 | 9.12 |
| 2005 | 5.15 | 8.03 |
| 2010 | 7.25 | 10.09 |
| 2015 | 7.25 | 9.3 |
| 2018 | 7.25 | 8.78 |
| 2019 | 7.25 | 8.61 |
| 2020 | 7.25 | 8.58 |
| 2021 | 7.25 | 8.24 |
| 2022 | 7.25 | 7.61 |
| 2023 | 7.25 | 7.25 |
What our graphic shows is how inflation has eroded the real value of the U.S. minimum wage over time, despite nominal increases.
For instance, consider the year 1960, when the federal minimum wage was $1 per hour. After accounting for inflation, this would be worth around $10.28 today!
The two lines converge at 2023 because the nominal and real value are identical in present day terms.
Many States Have Their Own Minimum Wage
According to the National Conference of State Legislatures (NCSL), 30 states and Washington, D.C. have implemented a minimum wage that is higher than $7.25.
The following states have adopted the federal minimum: Georgia, Idaho, Indiana, Iowa, Kansas, Kentucky, New Hampshire, North Carolina, North Dakota, Oklahoma, Pennsylvania, Texas, Utah, Wisconsin, and Wyoming.
Meanwhile, the states of Alabama, Louisiana, Mississippi, South Carolina, and Tennessee have no wage minimums, but have to follow the federal minimum.
How Does the U.S. Minimum Wage Rank Globally?
If you found this topic interesting, check out Mapped: Minimum Wage Around the World to see which countries have the highest minimum wage in monthly terms, as of January 2023.

-

 Mining1 week ago
Gold vs. S&P 500: Which Has Grown More Over Five Years?
-

 Markets2 weeks ago
Ranked: The Most Valuable Housing Markets in America
-

 Money2 weeks ago
Which States Have the Highest Minimum Wage in America?
-

 AI2 weeks ago
Ranked: Semiconductor Companies by Industry Revenue Share
-

 Markets2 weeks ago
Ranked: The World’s Top Flight Routes, by Revenue
-

 Countries2 weeks ago
Population Projections: The World’s 6 Largest Countries in 2075
-

 Markets2 weeks ago
The Top 10 States by Real GDP Growth in 2023
-

 Demographics2 weeks ago
The Smallest Gender Wage Gaps in OECD Countries