Markets
Ranked: The Best and Worst Pension Plans, by Country


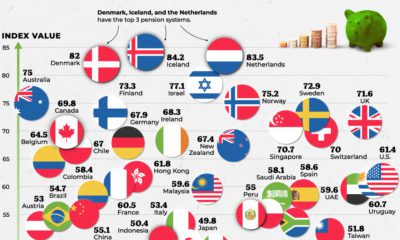
Ranked: Countries with the Best and Worst Pension Plans
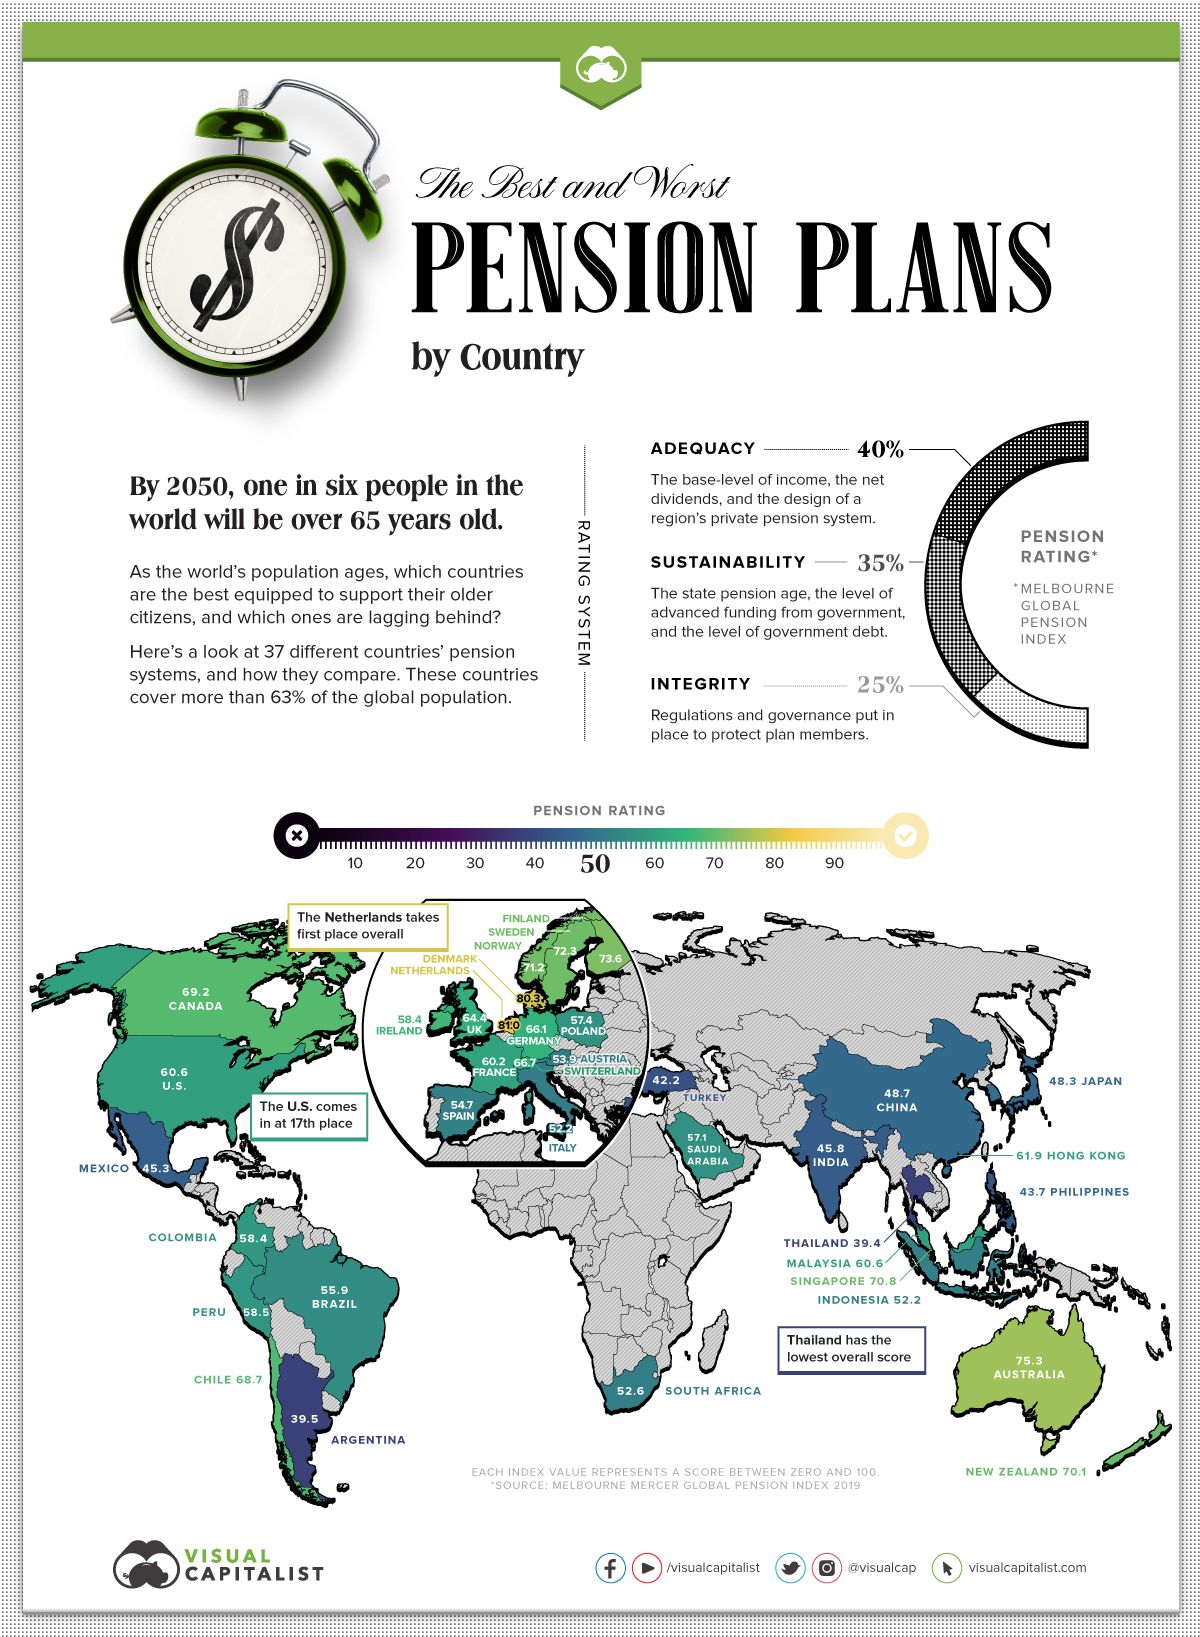
The global population is aging—by 2050, one in six people will be over the age of 65.
As our aging population nears retirement and gets closer to cashing in their pensions, countries need to ensure their pension systems can withstand the extra strain.
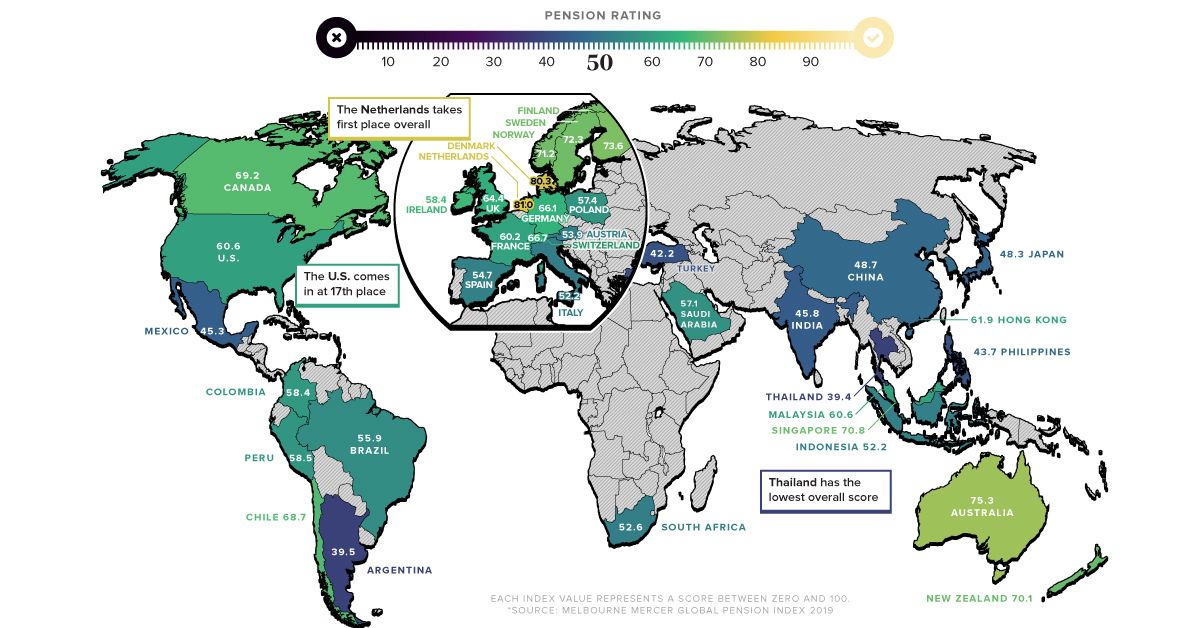
This graphic uses data from the Melbourne Mercer Global Pension Index (MMGPI) to showcase which countries are best equipped to support their older citizens, and which ones aren’t.
The Breakdown
Each country’s pension system has been shaped by its own economic and historical context. This makes it difficult to draw precise comparisons between countries—yet there are certain universal elements that typically lead to adequate and stable support for older citizens.
MMGPI organized these universal elements into three sub-indexes:
- Adequacy: The base-level of income, as well as the design of a region’s private pension system.
- Sustainability: The state pension age, the level of advanced funding from government, and the level of government debt.
- Integrity: Regulations and governance put in place to protect plan members.
These three measures were used to rank the pension system of 37 different countries, representing over 63% of the world’s population.
Here’s how each country ranked:
| Country | Overall Value | Adequacy | Sustainability | Integrity |
|---|---|---|---|---|
| Argentina | 39.5 | 43.1 | 31.9 | 44.4 |
| Australia | 75.3 | 70.3 | 73.5 | 85.7 |
| Austria | 53.9 | 68.2 | 22.9 | 74.4 |
| Brazil | 55.9 | 71.8 | 27.7 | 69.8 |
| Canada | 69.2 | 70 | 61.8 | 78.2 |
| Chile | 68.7 | 59.4 | 71.7 | 79.2 |
| China | 48.7 | 60.5 | 36.7 | 46.5 |
| Colombia | 58.4 | 61.4 | 46 | 70.8 |
| Denmark | 80.3 | 77.5 | 82 | 82.2 |
| Finland | 73.6 | 73.2 | 60.7 | 92.3 |
| France | 60.2 | 79.1 | 41 | 56.8 |
| Germany | 66.1 | 78.3 | 44.9 | 76.4 |
| Hong Kong | 61.9 | 54.5 | 54.5 | 86.9 |
| India | 45.8 | 39.9 | 44.9 | 56.3 |
| Indonesia | 52.2 | 46.7 | 47.6 | 67.5 |
| Ireland | 67.3 | 81.5 | 44.6 | 76.3 |
| Italy | 52.2 | 67.4 | 19 | 74.5 |
| Japan | 48.3 | 54.6 | 32.2 | 60.8 |
| Korea | 49.8 | 47.5 | 52.6 | 49.6 |
| Malaysia | 60.6 | 50.5 | 60.5 | 76.9 |
| Mexico | 45.3 | 37.5 | 57.1 | 41.3 |
| Netherlands | 81 | 78.5 | 78.3 | 88.9 |
| New Zealand | 70.1 | 70.9 | 61.5 | 80.7 |
| Norway | 71.2 | 71.6 | 56.8 | 90.6 |
| Peru | 58.5 | 60 | 52.4 | 64.7 |
| Philippines | 43.7 | 39 | 55.5 | 34.7 |
| Poland | 57.4 | 62.5 | 45.3 | 66 |
| Saudi Arabia | 57.1 | 59.6 | 50.5 | 62.2 |
| Singapore | 70.8 | 73.8 | 59.7 | 81.4 |
| South Africa | 52.6 | 42.3 | 46 | 78.4 |
| Spain | 54.7 | 70 | 26.9 | 69.1 |
| Sweden | 72.3 | 67.5 | 72 | 80.2 |
| Switzerland | 66.7 | 57.6 | 65.4 | 83 |
| Thailand | 39.4 | 35.8 | 38.8 | 46.1 |
| Turkey | 42.2 | 42.6 | 27.1 | 62.8 |
| UK | 64.4 | 60 | 55.3 | 84 |
| U.S. | 60.6 | 58.8 | 62.9 | 60.4 |
The Importance of Sustainability
While all three sub-indexes are important to consider when ranking a country’s pension system, sustainability is particularly significant in the modern context. This is because our global population is increasingly skewing older, meaning an influx of people will soon be cashing in their retirement funds. As a consequence, countries need to ensure their pension systems are sustainable over the long-term.
There are several factors that affect a pension system’s sustainability, including a region’s private pension system, the state pension age, and the balance between workers and retirees.
The country with the most sustainable pension system is Denmark. Not only does the country have a strong basic pension plan—it also has a mandatory occupational scheme, which means employers are obligated by law to provide pension plans for their employees.
Adequacy versus Sustainability
Several countries scored high on adequacy but ranked low when it came to sustainability. Here’s a comparison of both measures, and how each country scored:
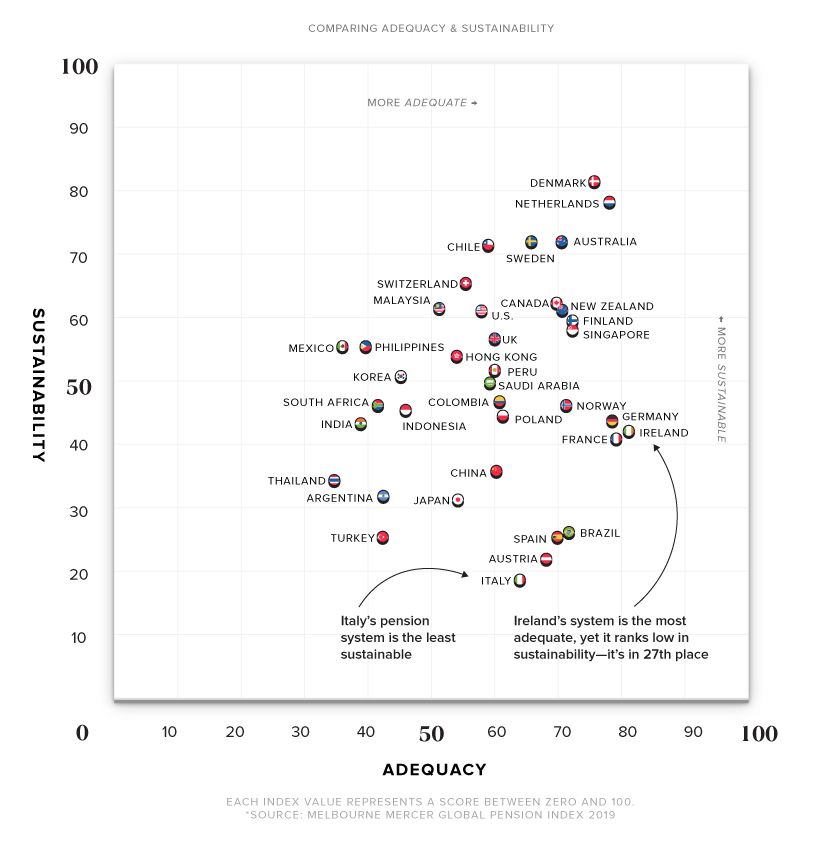
Ireland took first place for adequacy, but scored relatively low on the sustainability front at 27th place. This can be partly explained by Ireland’s low level of occupational coverage. The country also has a rapidly aging population, which skews the ratio of workers to retirees. By 2050, Ireland’s worker to retiree ratio is estimated to go from 5:1 to 2:1.
Similar to Ireland, Spain ranks high in adequacy but places extremely low in sustainability.
There are several possible explanations for this—while occupational pension schemes exist, they are optional and participation is low. Spain also has a low fertility rate, which means their worker-to-retiree ratio is expected to decrease.
Steps Towards a Better System
All countries have room for improvement—even the highest-ranking ones. Some general recommendations from MMGPI on how to build a better pension system include:
- Increasing the age of retirement: Helps maintain a more balanced worker-to-retiree ratio.
- Enforcing mandatory occupational schemes: Makes employers obligated to provide pension plans for their employees.
- Limiting access to benefits: Prevents people from dipping into their savings preemptively, thus preserving funds until retirement.
- Establishing strong pension assets to fund future liabilities: Ideally, these assets are more than 100% of a country’s GDP.
Pension systems across the globe are under an increasing amount of pressure. It’s time for countries to take a hard look at their pension systems to make sure they’re ready to support their aging population.


Markets
The European Stock Market: Attractive Valuations Offer Opportunities
On average, the European stock market has valuations that are nearly 50% lower than U.S. valuations. But how can you access the market?


European Stock Market: Attractive Valuations Offer Opportunities
Europe is known for some established brands, from L’Oréal to Louis Vuitton. However, the European stock market offers additional opportunities that may be lesser known.
The above infographic, sponsored by STOXX, outlines why investors may want to consider European stocks.
Attractive Valuations
Compared to most North American and Asian markets, European stocks offer lower or comparable valuations.
| Index | Price-to-Earnings Ratio | Price-to-Book Ratio |
|---|---|---|
| EURO STOXX 50 | 14.9 | 2.2 |
| STOXX Europe 600 | 14.4 | 2 |
| U.S. | 25.9 | 4.7 |
| Canada | 16.1 | 1.8 |
| Japan | 15.4 | 1.6 |
| Asia Pacific ex. China | 17.1 | 1.8 |
Data as of February 29, 2024. See graphic for full index names. Ratios based on trailing 12 month financials. The price to earnings ratio excludes companies with negative earnings.
On average, European valuations are nearly 50% lower than U.S. valuations, potentially offering an affordable entry point for investors.
Research also shows that lower price ratios have historically led to higher long-term returns.
Market Movements Not Closely Connected
Over the last decade, the European stock market had low-to-moderate correlation with North American and Asian equities.
The below chart shows correlations from February 2014 to February 2024. A value closer to zero indicates low correlation, while a value of one would indicate that two regions are moving in perfect unison.
| EURO STOXX 50 | STOXX EUROPE 600 | U.S. | Canada | Japan | Asia Pacific ex. China |
|
|---|---|---|---|---|---|---|
| EURO STOXX 50 | 1.00 | 0.97 | 0.55 | 0.67 | 0.24 | 0.43 |
| STOXX EUROPE 600 | 1.00 | 0.56 | 0.71 | 0.28 | 0.48 | |
| U.S. | 1.00 | 0.73 | 0.12 | 0.25 | ||
| Canada | 1.00 | 0.22 | 0.40 | |||
| Japan | 1.00 | 0.88 | ||||
| Asia Pacific ex. China | 1.00 |
Data is based on daily USD returns.
European equities had relatively independent market movements from North American and Asian markets. One contributing factor could be the differing sector weights in each market. For instance, technology makes up a quarter of the U.S. market, but health care and industrials dominate the broader European market.
Ultimately, European equities can enhance portfolio diversification and have the potential to mitigate risk for investors.
Tracking the Market
For investors interested in European equities, STOXX offers a variety of flagship indices:
| Index | Description | Market Cap |
|---|---|---|
| STOXX Europe 600 | Pan-regional, broad market | €10.5T |
| STOXX Developed Europe | Pan-regional, broad-market | €9.9T |
| STOXX Europe 600 ESG-X | Pan-regional, broad market, sustainability focus | €9.7T |
| STOXX Europe 50 | Pan-regional, blue-chip | €5.1T |
| EURO STOXX 50 | Eurozone, blue-chip | €3.5T |
Data is as of February 29, 2024. Market cap is free float, which represents the shares that are readily available for public trading on stock exchanges.
The EURO STOXX 50 tracks the Eurozone’s biggest and most traded companies. It also underlies one of the world’s largest ranges of ETFs and mutual funds. As of November 2023, there were €27.3 billion in ETFs and €23.5B in mutual fund assets under management tracking the index.
“For the past 25 years, the EURO STOXX 50 has served as an accurate, reliable and tradable representation of the Eurozone equity market.”
— Axel Lomholt, General Manager at STOXX
Partnering with STOXX to Track the European Stock Market
Are you interested in European equities? STOXX can be a valuable partner:
- Comprehensive, liquid and investable ecosystem
- European heritage, global reach
- Highly sophisticated customization capabilities
- Open architecture approach to using data
- Close partnerships with clients
- Part of ISS STOXX and Deutsche Börse Group
With a full suite of indices, STOXX can help you benchmark against the European stock market.
Learn how STOXX’s European indices offer liquid and effective market access.

-

 Economy1 day ago
Economic Growth Forecasts for G7 and BRICS Countries in 2024
The IMF has released its economic growth forecasts for 2024. How do the G7 and BRICS countries compare?
-

 Markets1 week ago
U.S. Debt Interest Payments Reach $1 Trillion
U.S. debt interest payments have surged past the $1 trillion dollar mark, amid high interest rates and an ever-expanding debt burden.
-

 United States1 week ago
Ranked: The Largest U.S. Corporations by Number of Employees
We visualized the top U.S. companies by employees, revealing the massive scale of retailers like Walmart, Target, and Home Depot.
-

 Markets2 weeks ago
The Top 10 States by Real GDP Growth in 2023
This graphic shows the states with the highest real GDP growth rate in 2023, largely propelled by the oil and gas boom.
-

 Markets2 weeks ago
Ranked: The World’s Top Flight Routes, by Revenue
In this graphic, we show the highest earning flight routes globally as air travel continued to rebound in 2023.
-

 Markets2 weeks ago
Ranked: The Most Valuable Housing Markets in America
The U.S. residential real estate market is worth a staggering $47.5 trillion. Here are the most valuable housing markets in the country.


-

 Mining1 week ago
Gold vs. S&P 500: Which Has Grown More Over Five Years?
-
Markets2 weeks ago
Ranked: The Most Valuable Housing Markets in America
-

 Money2 weeks ago
Which States Have the Highest Minimum Wage in America?
-

 AI2 weeks ago
Ranked: Semiconductor Companies by Industry Revenue Share
-
Markets2 weeks ago
Ranked: The World’s Top Flight Routes, by Revenue
-

 Demographics2 weeks ago
Population Projections: The World’s 6 Largest Countries in 2075
-
Markets2 weeks ago
The Top 10 States by Real GDP Growth in 2023
-

 Demographics2 weeks ago
The Smallest Gender Wage Gaps in OECD Countries