Markets
Ranked: The Best and Worst State Economies
View a high resolution version of this graphic
Ranked: The Best and Worst State Economies
View the high resolution version of today’s graphic by clicking here.
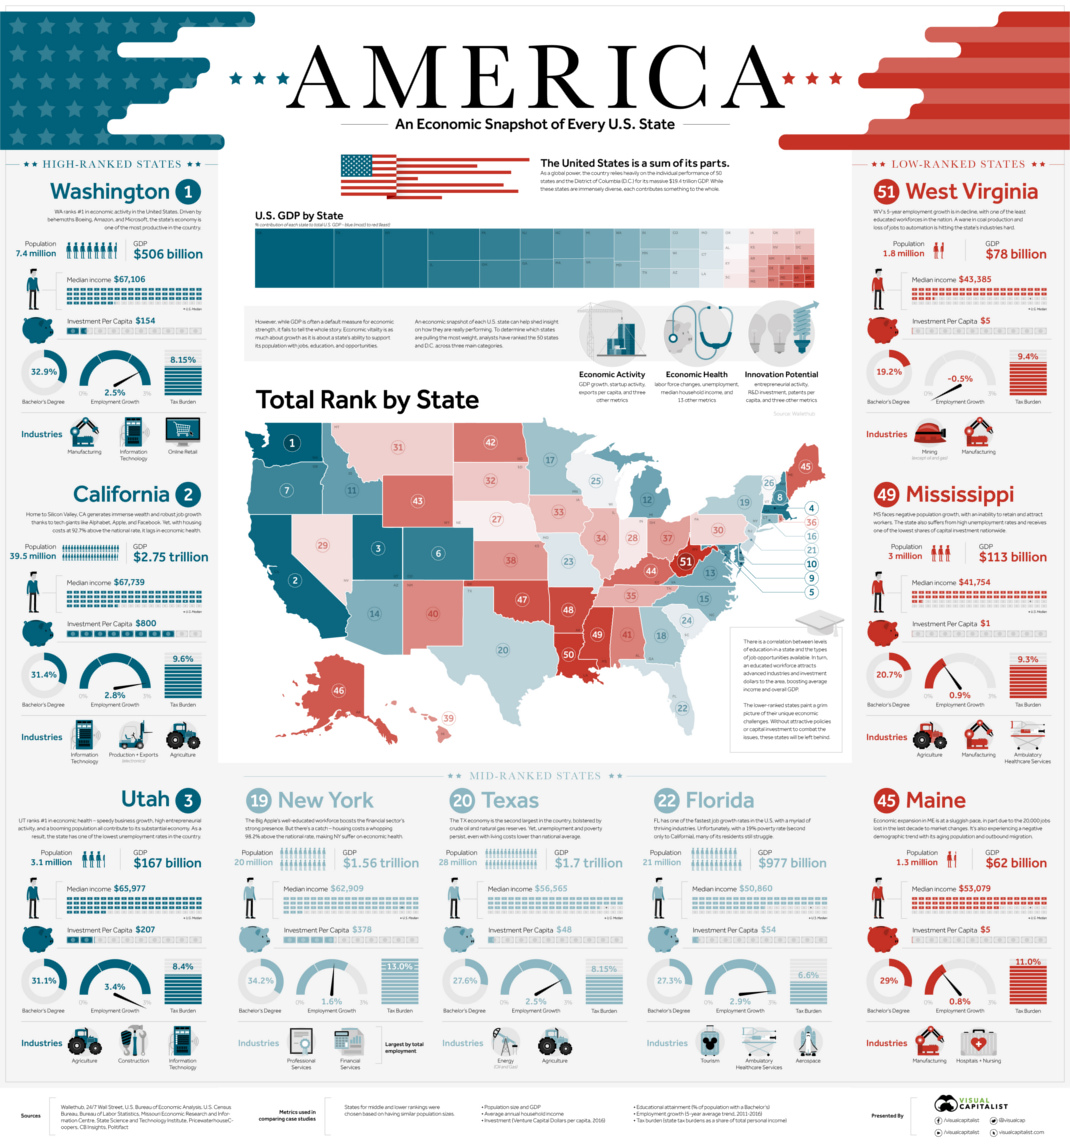
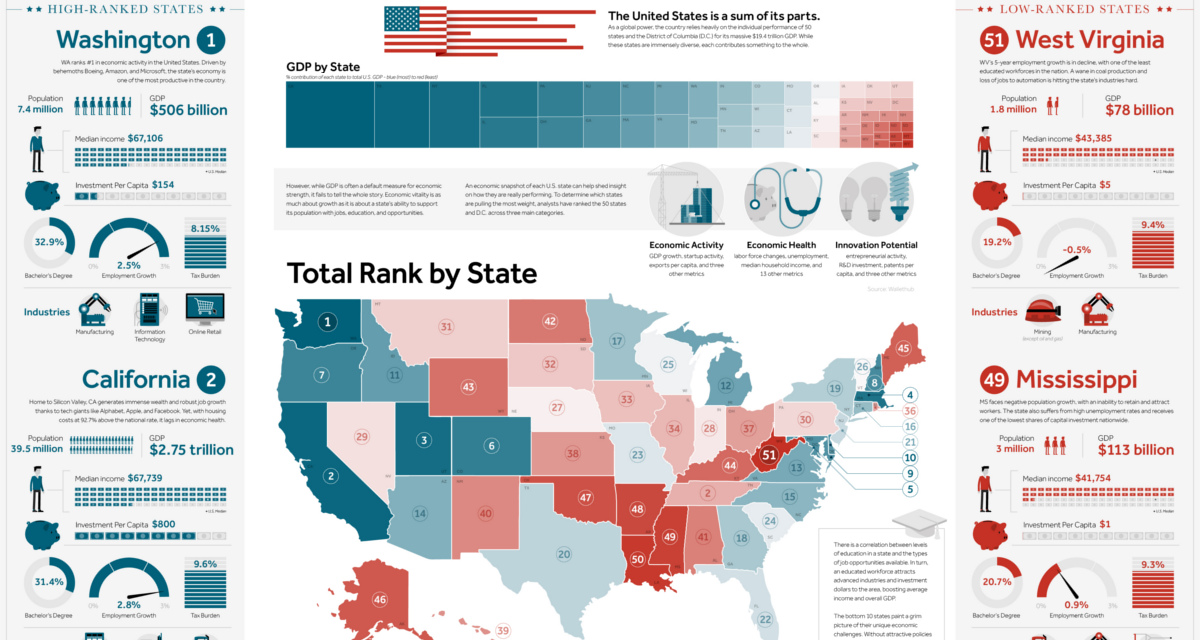
On a global scale, the U.S. economy is massive at close to $19 trillion in size.
However, the United States is also the sum of its parts. America represents the union of 50 states and other jurisdictions such as D.C., and all of these state-level economies have their own unique problems to overcome, drivers of growth, and local resources that factor into their prosperity.
How can we compare these state economies on an even playing field?
Ranked: State Economies
Using absolute numbers, it’s hard to directly compare California ($2.75 trillion GDP, 39.5 million people) to a state like Vermont ($33 billion, 0.6 million people). By leveling the playing field, we can get an idea of how states contrast in terms of relative economic strength that companies and workers would better recognize.
Today’s infographic uses 27 metrics from WalletHub to rank state economies. These metrics are grouped into three major categories, which are evenly weighted:
1. Economic Activity: GDP growth, startup activity, exports per capita, and three other metrics
2. Economic Health: Labor force changes, median household income, unemployment, and 13 other metrics
3. Innovation Potential: Entrepreneurial activity, R&D investment, patents per capita, and three other metrics
Note: the full methodology with all 27 factors can be found here.
Here’s how the rankings shake down, for all 50 state economies and D.C.:
| Overall | State | Total Score | Economic Activity | Economic Health | Innovation Potential |
|---|---|---|---|---|---|
| 1 | Washington | 76.5 | 1 | 4 | 3 |
| 2 | California | 73.8 | 2 | 26 | 2 |
| 3 | Utah | 73.8 | 5 | 1 | 4 |
| 4 | Massachusetts | 73.3 | 4 | 29 | 1 |
| 5 | District of Columbia | 67.1 | 3 | 6 | 13 |
| 6 | Colorado | 66.4 | 15 | 3 | 5 |
| 7 | Oregon | 65.7 | 6 | 9 | 10 |
| 8 | New Hampshire | 62.5 | 17 | 10 | 7 |
| 9 | Maryland | 61.0 | 18 | 28 | 6 |
| 10 | Delaware | 59.8 | 10 | 20 | 15 |
| 11 | Idaho | 58.2 | 21 | 2 | 19 |
| 12 | Michigan | 57.9 | 23 | 33 | 8 |
| 13 | Virginia | 57.5 | 9 | 18 | 23 |
| 14 | Arizona | 57.4 | 16 | 24 | 14 |
| 15 | North Carolina | 57.3 | 24 | 11 | 12 |
| 16 | Connecticut | 57.3 | 12 | 45 | 9 |
| 17 | Minnesota | 56.6 | 20 | 16 | 17 |
| 18 | Georgia | 56.0 | 8 | 21 | 29 |
| 19 | New York | 55.7 | 7 | 44 | 18 |
| 20 | Texas | 55.4 | 19 | 15 | 21 |
| 21 | New Jersey | 55.1 | 11 | 47 | 11 |
| 22 | Florida | 54.5 | 13 | 12 | 30 |
| 23 | Missouri | 50.2 | 34 | 19 | 24 |
| 24 | South Carolina | 49.8 | 14 | 23 | 41 |
| 25 | Wisconsin | 49.2 | 33 | 14 | 31 |
| 26 | Vermont | 49.1 | 35 | 31 | 22 |
| 27 | Nebraska | 49.0 | 36 | 7 | 34 |
| 28 | Indiana | 48.9 | 26 | 25 | 35 |
| 29 | Nevada | 48.1 | 22 | 27 | 40 |
| 30 | Pennsylvania | 47.7 | 25 | 41 | 27 |
| 31 | Montana | 47.7 | 46 | 13 | 25 |
| 32 | South Dakota | 47.1 | 39 | 5 | 39 |
| 33 | Iowa | 47.0 | 31 | 22 | 37 |
| 34 | Illinois | 46.9 | 27 | 43 | 26 |
| 35 | Tennessee | 46.4 | 29 | 17 | 44 |
| 36 | Rhode Island | 46.0 | 40 | 40 | 20 |
| 37 | Ohio | 45.7 | 30 | 42 | 28 |
| 38 | Kansas | 44.3 | 43 | 34 | 32 |
| 39 | Hawaii | 43.7 | 38 | 30 | 38 |
| 40 | New Mexico | 42.1 | 44 | 51 | 16 |
| 41 | Alabama | 41.6 | 32 | 38 | 43 |
| 42 | North Dakota | 41.1 | 51 | 8 | 36 |
| 43 | Wyoming | 39.4 | 47 | 32 | 45 |
| 44 | Kentucky | 38.9 | 28 | 46 | 48 |
| 45 | Maine | 38.9 | 37 | 36 | 47 |
| 46 | Alaska | 37.7 | 50 | 39 | 33 |
| 47 | Oklahoma | 37.1 | 49 | 37 | 42 |
| 48 | Arkansas | 35.9 | 45 | 35 | 50 |
| 49 | Mississippi | 35.0 | 41 | 48 | 46 |
| 50 | Louisiana | 33.2 | 42 | 50 | 49 |
| 51 | West Virginia | 28.1 | 48 | 49 | 51 |
Topping the list for overall score were the states of Washington, California, and Utah, and the first place state in each major category includes Washington (Economic Activity), Utah (Economic Health), and Massachusetts (Innovation Potential).
Case in Point
Looking at statistics and scoring methodologies alone can be a bit esoteric, so let’s look at some individual cases to see some contrast.
Utah (Rank: #3)
Utah consistently ranks as one of the top states for business, in the country, as well as a top state for job growth and employment. It’s also pretty unique in that it has a fairly diversified economy, with major sectors in the tourism, agriculture, tech, manufacturing, finance, energy, and mining industries.
Utah has a higher median household income ($65,977), and a blistering 3.4% employment growth rate.
Florida (Rank: #22)
Using this methodology, Florida falls somewhere in the middle of the rankings. The good news is the state has good employment growth (2.9%) and a myriad of thriving industries like aerospace. The bad news? Florida has the second-highest level of poverty in the union at 19%, and it also has a lower median household income ($50,860) than the national average.
Maine (Rank: #45)
Economic activity is sluggish in the country’s most northeastern state. With an aging population, slow employment growth (0.8%), and a number of lost manufacturing jobs over the last 15 years, the state is trying to rebound. Maine isn’t helped by having one of the highest tax burdens for its citizens and businesses in the country, either.


Markets
U.S. Debt Interest Payments Reach $1 Trillion
U.S. debt interest payments have surged past the $1 trillion dollar mark, amid high interest rates and an ever-expanding debt burden.


U.S. Debt Interest Payments Reach $1 Trillion
This was originally posted on our Voronoi app. Download the app for free on iOS or Android and discover incredible data-driven charts from a variety of trusted sources.
The cost of paying for America’s national debt crossed the $1 trillion dollar mark in 2023, driven by high interest rates and a record $34 trillion mountain of debt.
Over the last decade, U.S. debt interest payments have more than doubled amid vast government spending during the pandemic crisis. As debt payments continue to soar, the Congressional Budget Office (CBO) reported that debt servicing costs surpassed defense spending for the first time ever this year.
This graphic shows the sharp rise in U.S. debt payments, based on data from the Federal Reserve.
A $1 Trillion Interest Bill, and Growing
Below, we show how U.S. debt interest payments have risen at a faster pace than at another time in modern history:
| Date | Interest Payments | U.S. National Debt |
|---|---|---|
| 2023 | $1.0T | $34.0T |
| 2022 | $830B | $31.4T |
| 2021 | $612B | $29.6T |
| 2020 | $518B | $27.7T |
| 2019 | $564B | $23.2T |
| 2018 | $571B | $22.0T |
| 2017 | $493B | $20.5T |
| 2016 | $460B | $20.0T |
| 2015 | $435B | $18.9T |
| 2014 | $442B | $18.1T |
| 2013 | $425B | $17.2T |
| 2012 | $417B | $16.4T |
| 2011 | $433B | $15.2T |
| 2010 | $400B | $14.0T |
| 2009 | $354B | $12.3T |
| 2008 | $380B | $10.7T |
| 2007 | $414B | $9.2T |
| 2006 | $387B | $8.7T |
| 2005 | $355B | $8.2T |
| 2004 | $318B | $7.6T |
| 2003 | $294B | $7.0T |
| 2002 | $298B | $6.4T |
| 2001 | $318B | $5.9T |
| 2000 | $353B | $5.7T |
| 1999 | $353B | $5.8T |
| 1998 | $360B | $5.6T |
| 1997 | $368B | $5.5T |
| 1996 | $362B | $5.3T |
| 1995 | $357B | $5.0T |
| 1994 | $334B | $4.8T |
| 1993 | $311B | $4.5T |
| 1992 | $306B | $4.2T |
| 1991 | $308B | $3.8T |
| 1990 | $298B | $3.4T |
| 1989 | $275B | $3.0T |
| 1988 | $254B | $2.7T |
| 1987 | $240B | $2.4T |
| 1986 | $225B | $2.2T |
| 1985 | $219B | $1.9T |
| 1984 | $205B | $1.7T |
| 1983 | $176B | $1.4T |
| 1982 | $157B | $1.2T |
| 1981 | $142B | $1.0T |
| 1980 | $113B | $930.2B |
| 1979 | $96B | $845.1B |
| 1978 | $84B | $789.2B |
| 1977 | $69B | $718.9B |
| 1976 | $61B | $653.5B |
| 1975 | $55B | $576.6B |
| 1974 | $50B | $492.7B |
| 1973 | $45B | $469.1B |
| 1972 | $39B | $448.5B |
| 1971 | $36B | $424.1B |
| 1970 | $35B | $389.2B |
| 1969 | $30B | $368.2B |
| 1968 | $25B | $358.0B |
| 1967 | $23B | $344.7B |
| 1966 | $21B | $329.3B |
Interest payments represent seasonally adjusted annual rate at the end of Q4.
At current rates, the U.S. national debt is growing by a remarkable $1 trillion about every 100 days, equal to roughly $3.6 trillion per year.
As the national debt has ballooned, debt payments even exceeded Medicaid outlays in 2023—one of the government’s largest expenditures. On average, the U.S. spent more than $2 billion per day on interest costs last year. Going further, the U.S. government is projected to spend a historic $12.4 trillion on interest payments over the next decade, averaging about $37,100 per American.
Exacerbating matters is that the U.S. is running a steep deficit, which stood at $1.1 trillion for the first six months of fiscal 2024. This has accelerated due to the 43% increase in debt servicing costs along with a $31 billion dollar increase in defense spending from a year earlier. Additionally, a $30 billion increase in funding for the Federal Deposit Insurance Corporation in light of the regional banking crisis last year was a major contributor to the deficit increase.
Overall, the CBO forecasts that roughly 75% of the federal deficit’s increase will be due to interest costs by 2034.

-

 Mining2 weeks ago
Charted: The Value Gap Between the Gold Price and Gold Miners
-

 Real Estate1 week ago
Ranked: The Most Valuable Housing Markets in America
-

 Business1 week ago
Charted: Big Four Market Share by S&P 500 Audits
-

 AI1 week ago
The Stock Performance of U.S. Chipmakers So Far in 2024
-

 Misc1 week ago
Almost Every EV Stock is Down After Q1 2024
-

 Money2 weeks ago
Where Does One U.S. Tax Dollar Go?
-

 Green2 weeks ago
Ranked: Top Countries by Total Forest Loss Since 2001
-

 Real Estate2 weeks ago
Visualizing America’s Shortage of Affordable Homes