Energy
The Periodic Table of Commodity Returns
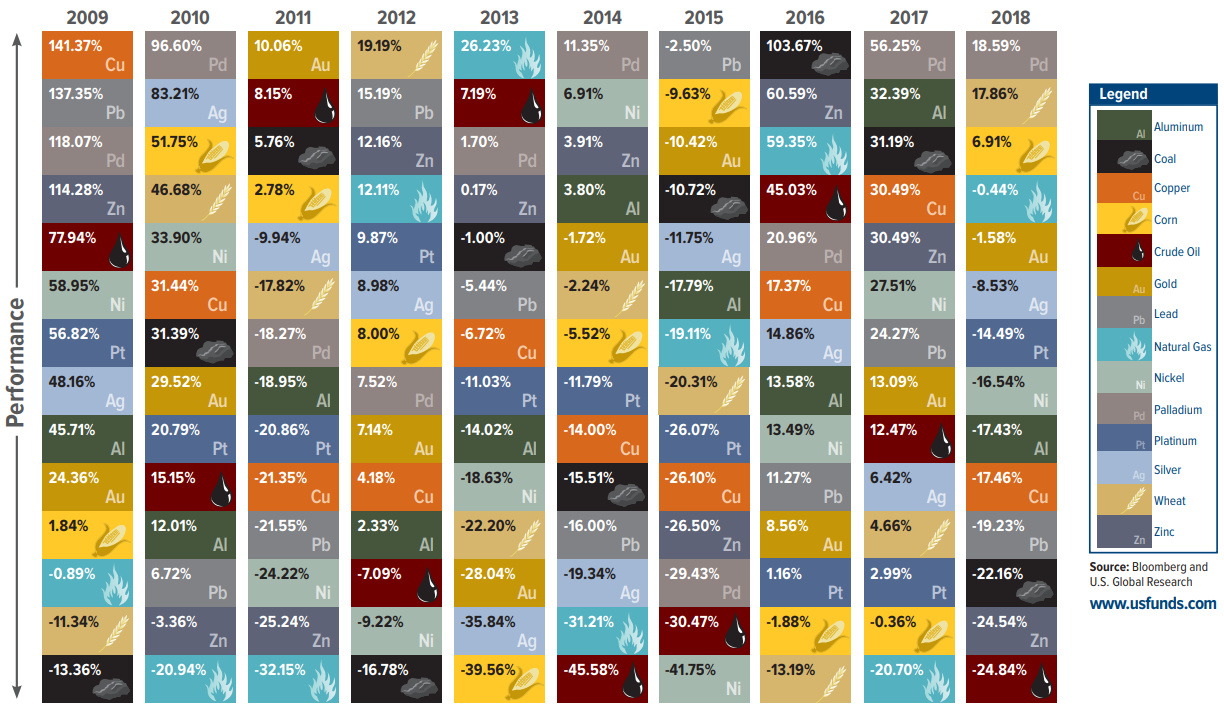
Periodic Table of Commodity Returns (2019 Edition)
Commodities are an interesting asset class to watch.
In certain years, all commodities will move in price together in an obvious and correlated fashion. This is a representation of the cyclical characteristics of commodity markets, in which macroeconomic factors align to create a tide that lifts or sinks all boats.
At the same time, however, each individual commodity is incredibly unique with its own specific set of supply and demand circumstances. In the years when these supply or demand crunches materialize, a certain commodity can surge or crash in price, separating itself from the rest of the pack.
A Decade of Commodity Returns
Today’s visualization comes to us from our friends at U.S. Global Investors, and it tracks commodity returns over the last decade.
More specifically, it takes a closer look at individual commodities (i.e. corn, gold, oil, zinc) to show how performance can vary over time. With a quick examination of the graphic, you can see years where commodities moved together – and some years where individual commodities stole the show unexpectedly.
Palladium: A Perennial Winner
The best performing commodity in 2018 was palladium, which found itself up 18.6% – just enough to edge out corn, which jumped up 17.9% in price last year.
Interestingly, palladium has also been the best performing commodity over the 10-year period as well:
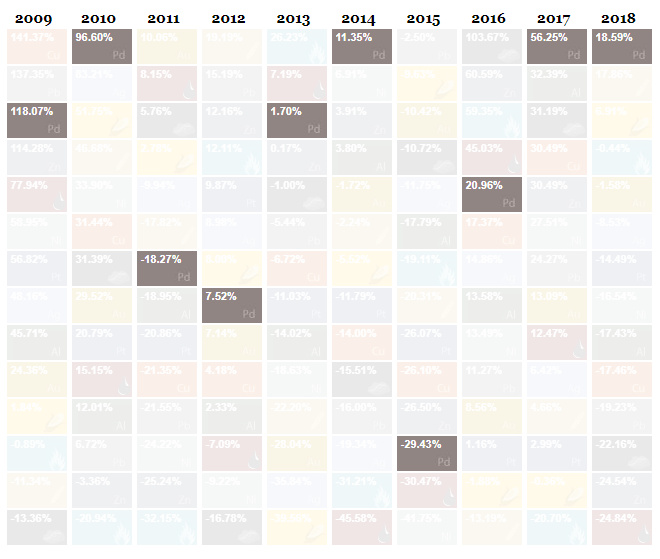
Palladium has finished in first place in four of the last 10 years, including in 2017 and 2018 – it’s also impressive to note that palladium has only had negative returns twice in the last decade (2011, 2015).
A Crude Awakening
The worst performing commodity in 2018 was crude oil, which fell -24.8% in price.
Like palladium, this wasn’t a unique occurrence: crude has actually been the worst performing commodity investment over the last decade:
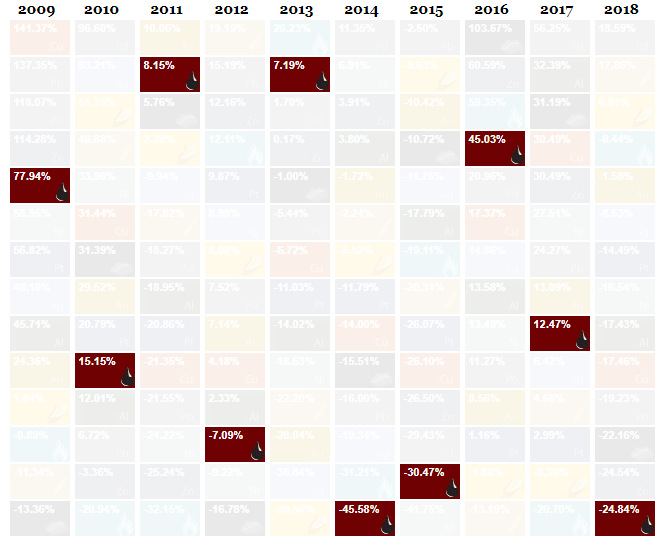
As you can see, crude oil has been the worst (or second worst) commodity in three of the last five years.
Further, as our chart on how all assets performed in 2018 shows, crude oil was outperformed by every other asset class, and the energy sector had the poorest performance out of all S&P 500 sectors last year.


Energy
The World’s Biggest Nuclear Energy Producers
China has grown its nuclear capacity over the last decade, now ranking second on the list of top nuclear energy producers.


The World’s Biggest Nuclear Energy Producers
This was originally posted on our Voronoi app. Download the app for free on Apple or Android and discover incredible data-driven charts from a variety of trusted sources.
Scientists in South Korea recently broke a record in a nuclear fusion experiment. For 48 seconds, they sustained a temperature seven times that of the sun’s core.
But generating commercially viable energy from nuclear fusion still remains more science fiction than reality. Meanwhile, its more reliable sibling, nuclear fission, has been powering our world for many decades.
In this graphic, we visualized the top producers of nuclear energy by their share of the global total, measured in terawatt hours (TWh). Data for this was sourced from the Nuclear Energy Institute, last updated in August 2022.
Which Country Generates the Most Nuclear Energy?
Nuclear energy production in the U.S. is more than twice the amount produced by China (ranked second) and France (ranked third) put together. In total, the U.S. accounts for nearly 30% of global nuclear energy output.
However, nuclear power only accounts for one-fifth of America’s electricity supply. This is in contrast to France, which generates 60% of its electricity from nuclear plants.
| Rank | Country | Nuclear Energy Produced (TWh) | % of Total |
|---|---|---|---|
| 1 | 🇺🇸 U.S. | 772 | 29% |
| 2 | 🇨🇳 China | 383 | 14% |
| 3 | 🇫🇷 France | 363 | 14% |
| 4 | 🇷🇺 Russia | 208 | 8% |
| 5 | 🇰🇷 South Korea | 150 | 6% |
| 6 | 🇨🇦 Canada | 87 | 3% |
| 7 | 🇺🇦 Ukraine | 81 | 3% |
| 8 | 🇩🇪 Germany | 65 | 2% |
| 9 | 🇯🇵 Japan | 61 | 2% |
| 10 | 🇪🇸 Spain | 54 | 2% |
| 11 | 🇸🇪 Sweden | 51 | 2% |
| 12 | 🇧🇪 Belgium | 48 | 2% |
| 13 | 🇬🇧 UK | 42 | 2% |
| 14 | 🇮🇳 India | 40 | 2% |
| 15 | 🇨🇿 Czech Republic | 29 | 1% |
| N/A | 🌐 Other | 219 | 8% |
| N/A | 🌍 Total | 2,653 | 100% |
Another highlight is how China has rapidly grown its nuclear energy capabilities in the last decade. Between 2016 and 2021, for example, it increased its share of global nuclear energy output from less than 10% to more than 14%, overtaking France for second place.
On the opposite end, the UK’s share has slipped to 2% over the same time period.
Meanwhile, Ukraine has heavily relied on nuclear energy to power its grid. In March 2022, it lost access to its key Zaporizhzhia Nuclear Power Station after Russian forces wrested control of the facility. With six 1,000 MW reactors, the plant is one of the largest in Europe. It is currently not producing any power, and has been the site of recent drone attacks.

-

 Maps2 weeks ago
Mapped: Average Wages Across Europe
-

 Money1 week ago
Which States Have the Highest Minimum Wage in America?
-

 Real Estate1 week ago
Ranked: The Most Valuable Housing Markets in America
-

 Markets1 week ago
Charted: Big Four Market Share by S&P 500 Audits
-

 AI1 week ago
The Stock Performance of U.S. Chipmakers So Far in 2024
-

 Automotive1 week ago
Almost Every EV Stock is Down After Q1 2024
-

 Money2 weeks ago
Where Does One U.S. Tax Dollar Go?
-

 Green2 weeks ago
Ranked: Top Countries by Total Forest Loss Since 2001