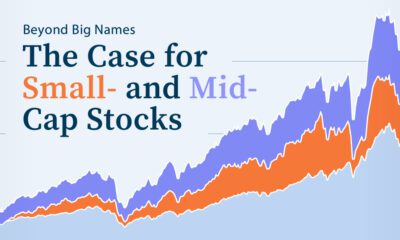
Small- and mid-cap stocks have historically outperformed large caps. What are the opportunities and risks to consider?


click for more →


Scan with your phone's camera or QR code app to view
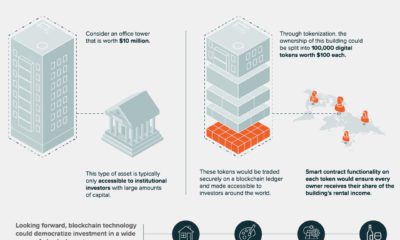

Tokenization is a future application of blockchain technology, and it could make investing in physical assets much easier. (Sponsored Content)


The Greek alphabet is just one part of the modern alphabet’s long evolution.
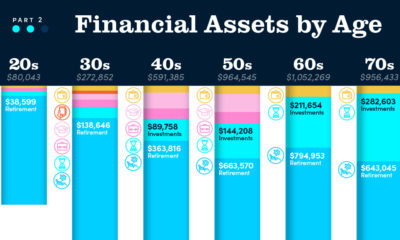

Are your account balances on track compared to others in your age group? Find out in this graphic, which breaks down financial assets by age.
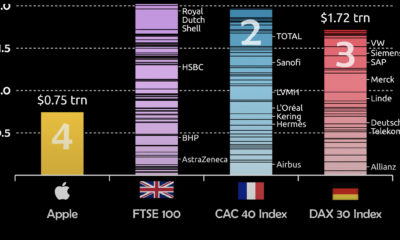

Apple's market cap recently hit $3 trillion. To put that scale into context, this visualization compares Apple to European indexes.


From increased robotization to lights-out manufacturing, this infographic breaks down the Industry 4.0 rollout.
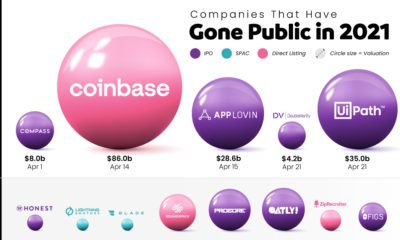

Tracking the companies that have gone public in 2021, their valuation, and how they did it.
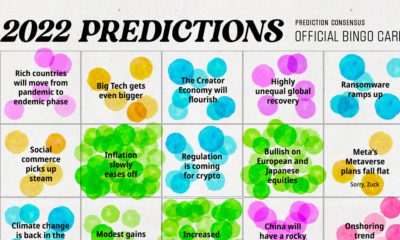

We analyzed 300+ articles, reports, and interviews to answer the question: is there any consensus on 2022 predictions? Here are the results.
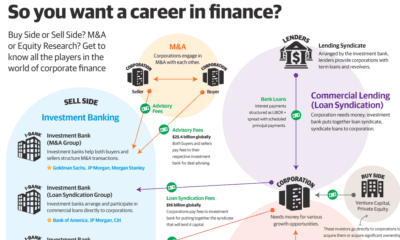

Corporate finance oversees trillions of dollars and makes modern markets and economies possible, but who are the main players?


2021 was a strong year for stocks, commodities, and cryptocurrencies, as most asset classes provided positive returns.
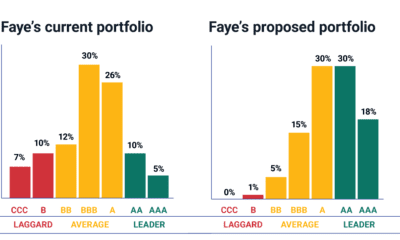

Wealth managers can use insights to improve the ESG qualities of their clients' financial portfolio, and improve their risk/return profile.

Get a jump start to your New Year with our Global Forecast series, the best online tools used by the VC team, and more.
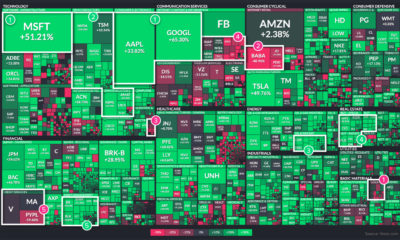

2021 was yet another tumultuous year. Which stock market sectors thrived during the twists and turns of the last 12 months, and which faltered?
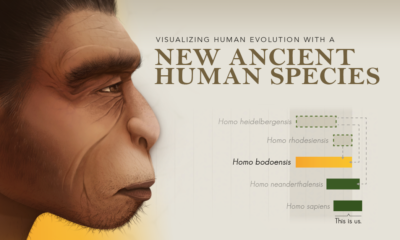

We visualize changes to our understanding of human evolution with the introduction of a new ancient human species, Homo bodoensis.
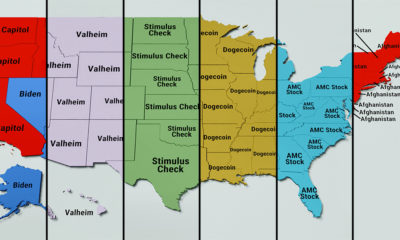

From presidential elections, to cryptocurrencies and billionaires, here are the trending searches in every U.S. state in 2021.


In this eighth edition of our yearly round-up, we highlight visualizations that broke new ground in design and data-driven reporting.
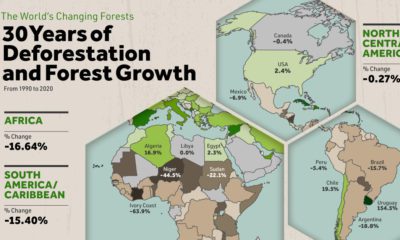

Where are the world's forests still shrinking, and where are they seeing net gains? We map deforestation by country between 1990-2020.
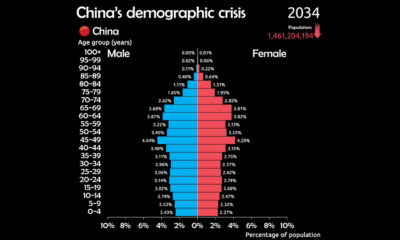

See why China is facing a demographic crisis in this animated chart.


 Creator Program