
Tracking Gallup survey data for more than a decade reveals insights into the regions seeing happiness gains.


click for more →


Scan with your phone's camera or QR code app to view


This graphic illustrates the size of the top 20 Chinese stocks, along with their 1-year return as of March 2024.


Sovereign wealth funds have scaled up their green investments in the push towards decarbonizing the global economy.
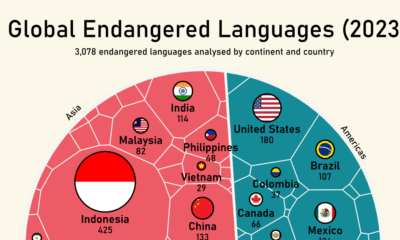

Almost half of the world’s approximately 7,000 languages are considered endangered.


Heavily armed and armored, the modern tank is a versatile and mobile weapons platform, and a critical piece of contemporary warfare.


Currently, Russia is the largest foreign supplier of nuclear power fuel to the U.S.


In 2023, several investment themes outperformed the S&P 500 by a wide margin. Here are the top performers—from blockchain to AI.


This graphic illustrates the biggest stock markets by country, providing a unique breakdown of $110 trillion in valuation.
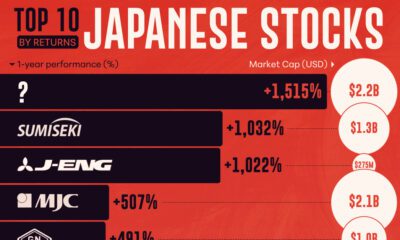

With the Nikkei 225 hitting its first all-time high since 1989, we've ranked the top 10 Japanese stocks by their 1-yr return.


Here are the banks with the highest concentration of commercial real estate loans as the sector faces mounting pressures.
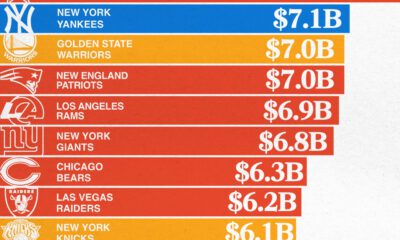

The most valuable sports teams in 2024 range from NBA and MLB teams to renowned soccer clubs in Europe, but the NFL reigned supreme.
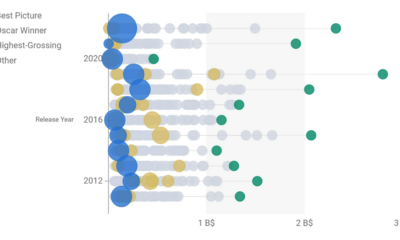

This data-driven exploration examines the relationship between Best Picture Oscar winners and box office performance over the past 30 years.


Here's how carbon dioxide removal methods could help us meet net-zero targets and and stabilize the climate.


This graphic illustrates the amount of U.S. currency in circulation globally, by denomination, based on data from the Federal Reserve.


Advanced semiconductors drive technological innovation across various industries. Here, we visualize foundry capacity by country.


In this graphic, we rank the top eight Bitcoin ETFs in the U.S. by their total assets under management (AUM).
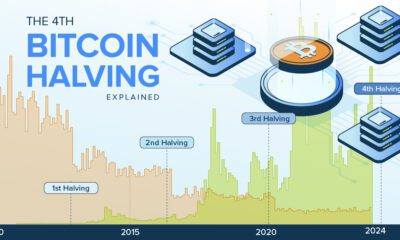

We take a deep dive on historical Bitcoin data from Coinmetrics to see what lessons the 3 previous halvings might have for the future.
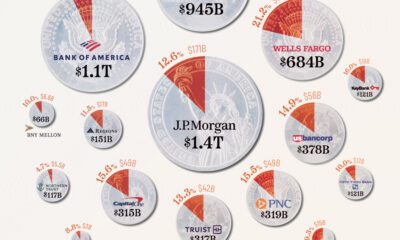

This graphic shows the 20 largest U.S. banks by assets, and their exposure to commercial real estate as a percentage of total loans.


 Creator Program