
In this graphic, we show asset class returns across U.S. equities, bonds, real estate, gold and cash since 1970.


click for more →


Scan with your phone's camera or QR code app to view
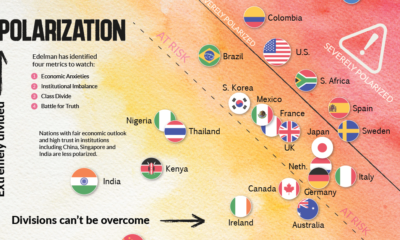

This chart plots polarization for various countries based on the Edelman Trust Institute's annual survey of 32,000+ people.


This table shows the fluctuating returns for various commodities over the past decade, from energy fuels to industrial and precious metals.
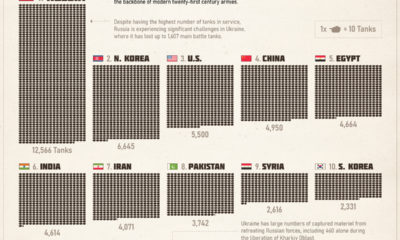

The tank remains the backbone of modern twenty-first century armies. This infographic shows what countries have the largest combat fleets.
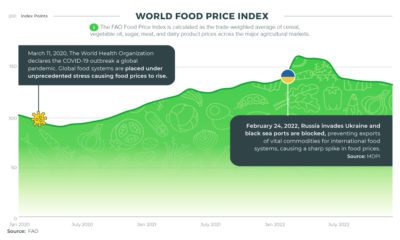

Many variables contribute to the rising cost of global food. Let's take a look at two major factors influencing food prices in recent years.
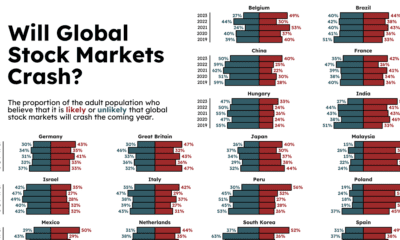

How likely are the stock markets to crash in 2023, according to different countries? And how have those predictions changed over time?
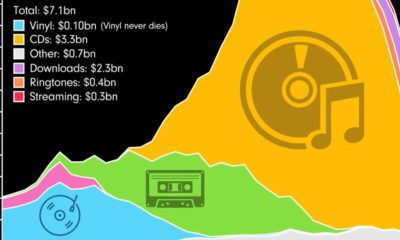

50 years in music has seen consumption change from vinyl and cassettes to CDs and streaming. This video highlights sales of music formats over time.
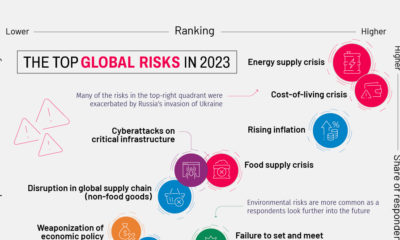

This year's Global Risks Report highlights ongoing economic issues, such as inflation, as well as existential threats like biological weapons
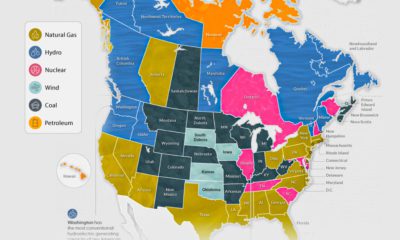

The U.S. and Canada rely on a different makeup of sources to generate their electricity. How does each state and province make theirs?
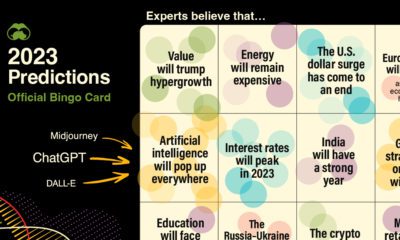

Using our database of 500+ predictions from reports, articles, interviews, and more, we highlight what experts think will happen in 2023
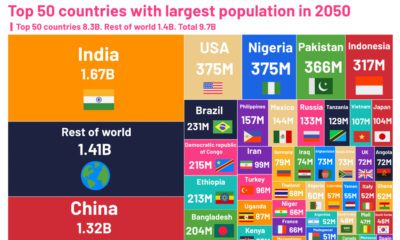

These charts highlight the changing world population between 2022 and 2050, showing which countries are growing—and shrinking—the fastest.
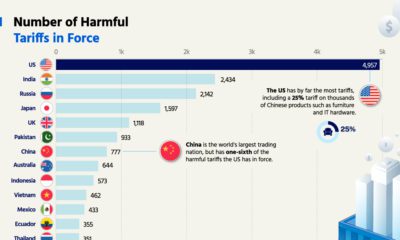

The U.S. has by far the most harmful tariffs, with nearly 5,000 in force. Which economy has the least tariffs?


Since 2008, the value of unrecorded dollar debt has doubled. Here's why this is increasing risk in global financial markets.
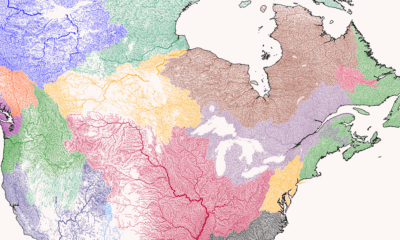

Where does each river start, converge, and end? This series of maps traces river basins in each continent around the world.
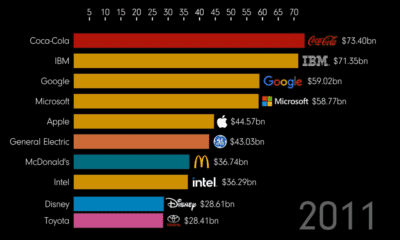

How much money is in a brand? And which brands have risen and fallen? This animation tracks the most valuable brands over 20+ years
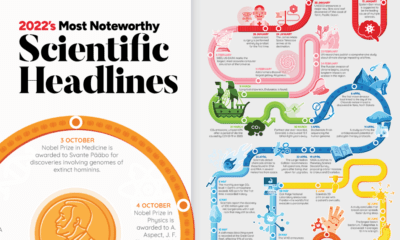

Join us as we look back at some of the most exciting, inspiring, and biggest science stories that made headlines in 2022.
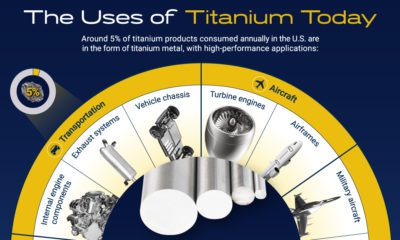

This infographic explores titanium's growth markets and potential for mainstream application.
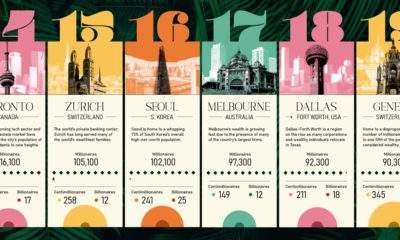

This ranking of the world's wealthiest cities leverages a robust data set that tracks the location and net worth of ultra-wealthy individuals


 Creator Program