
Listing the many programs—health, defense, veterans benefits—that U.S. federal taxes fund, in the form of a single federal tax dollar.


click for more →


Scan with your phone's camera or QR code app to view


Analyzing 2023 per capita GDP numbers from the International Monetary Fund lets us know where the poorest countries are.


As the market for low-emission solutions expands, China dominates the production of clean energy technologies and their components.
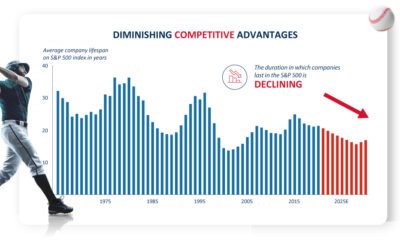

What can innovation investing learn from baseball? See how hitting home runs and singles are akin to different forms of innovation investing.
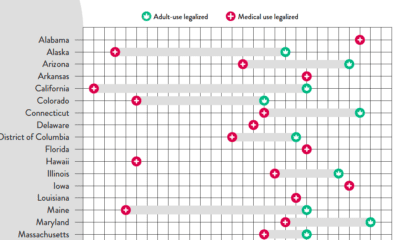

At the federal level, cannabis is illegal, but state laws differ. This graphic looks at the timelines of cannabis legislation in the U.S.
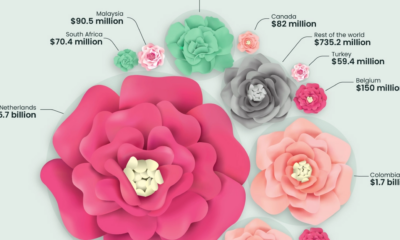

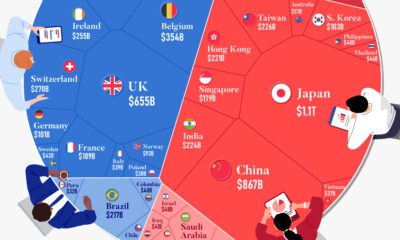
This graphic highlights global flower bouquet sales in 2021 and how a few countries dominate the entire flower export market.
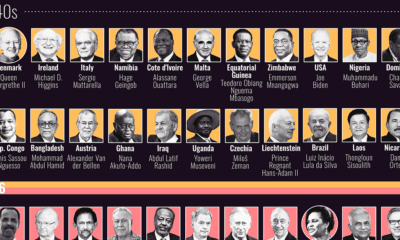

This graphic visualizes the ages of every country’s head of state, and compares them with the median population of their respective states.

Foreign investors hold $7.3 trillion of the national U.S. debt. These holdings declined 6% in 2022 amid a strong U.S. dollar and rising rates.
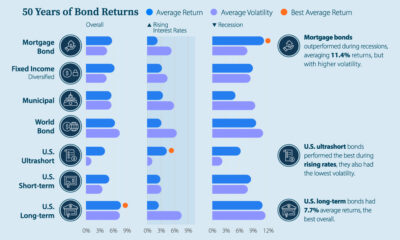

What factors impact the bond market? Here's how current interest rates, bond returns, and market volatility compare in a historical context.


How have investment returns for different portfolio allocations of stocks and bonds compared over the last 90 years?


This infographic examines 50 years of data to highlight a clear visual trend: recessions are preceded by a cyclical low in unemployment.


From clean electricity to high reliability, this graphic explores the five key advantages of nuclear power in the clean energy transition.
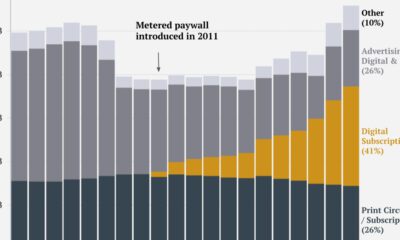

This graphic tracks the New York Times’ revenue streams over the past two decades, identifying its transition from advertising to subscription-reliant.
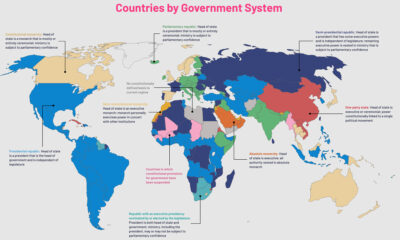

The political regimes of the world's countries have changed over centuries. This map charts the nine government systems that rule the world today.


Where do the happiest people on earth live? This map is a snapshot of the world's most (and least) happy countries in 2023.
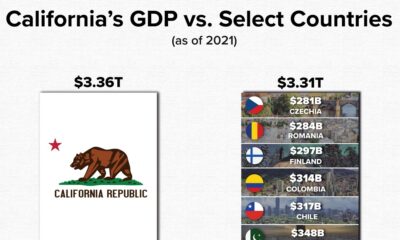

California’s GDP makes the state one of the most powerful economies in the world. This graphic compares it to the GDP of 10 select countries.
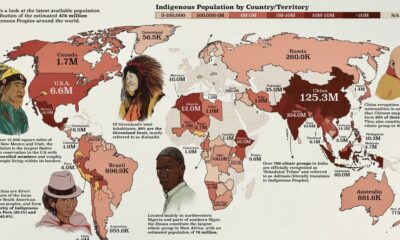

This map by shows the population distribution of the roughly 476 million Indigenous groups around the world.
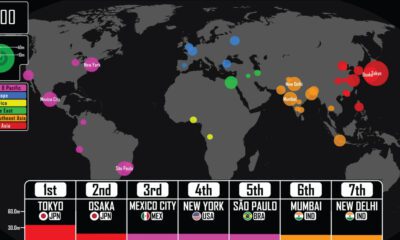

Where were the largest cities in the world throughout history? This video details the rise (and fall) of the largest cities by population from 3,000 BCE.


 Creator Program