
U.S. debt interest payments have surged past the $1 trillion dollar mark, amid high interest rates and an ever-expanding debt...


click for more →


Scan with your phone's camera or QR code app to view
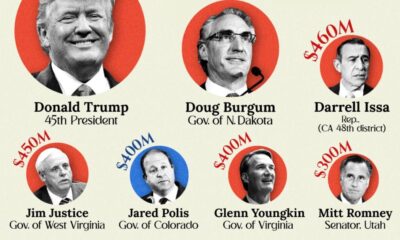

Donald Trump, Mitt Romney, J.B. Pritzker. This infographic is a snapshot of the richest politicians in the U.S.
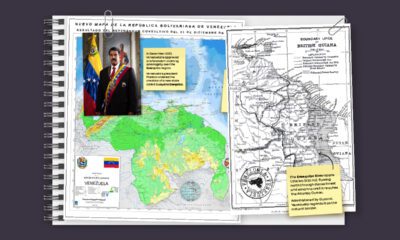

In this series of maps, we explain the dispute that has spanned nearly two centuries over the vast Essequibo region.
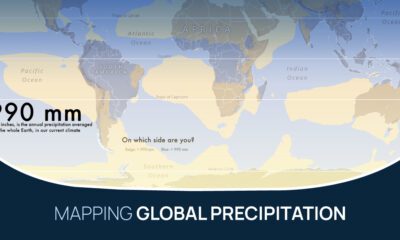

What does the global precipitation map look like if we split it in two, one half with below average rainfall and the other above?
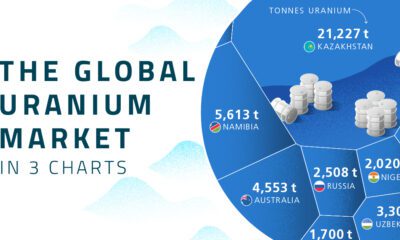

Four countries account for over 70% of global uranium production.
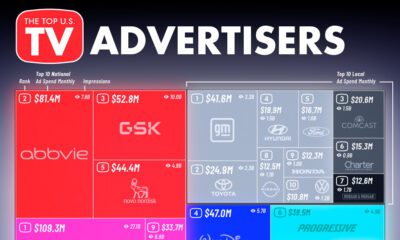

Which companies spend the most on traditional TV advertising? From pharmaceutical giants to big tech firms, we show the top spenders in 2023.
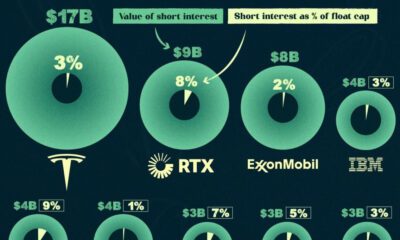

In this infographic, we list the 15 most shorted stocks in the U.S. in the Fall of 2023, ranked by the value of their short interest.
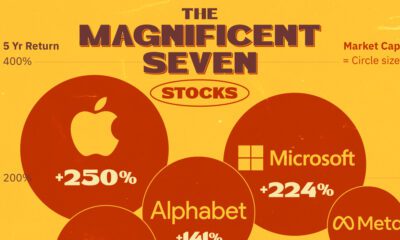

FAANG is dead… meet the 'Magnificent Seven' stocks that now make up over 25% of the S&P 500.
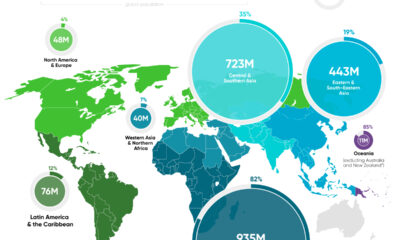

In this graphic, we map the number of people relying on harmful cooking fuels by region, using data from the World Health Organization.


Which countries rank the highest in per capita carbon emissions, and how do they impact the world's total carbon emissions?
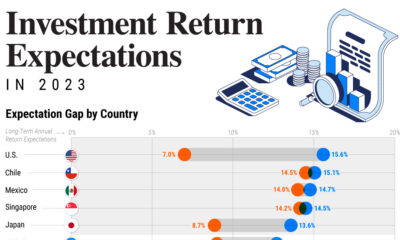

This graphic shows the gap in portfolio return expectations between investors and advisors around the world, revealing a range of market outlooks.


Dive into the GTA budget through the years, with GTA VI set to be the most expensive video game of all time.
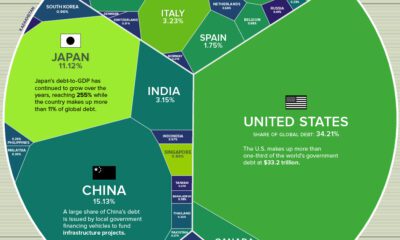

Global debt has soared since the pandemic. Which countries have the biggest stockpile of debt outstanding in 2023?
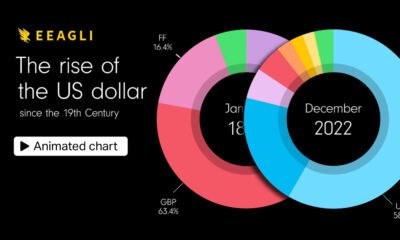

This animated graphic shows the U.S. dollar, the world's primary reserve currency, as a share of foreign reserves since 1900.
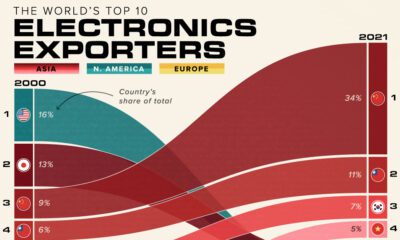

Here are the largest electronics exporters by country, highlighting how electronics trade has increasingly shifted to Asia over 20 years.


Media trust among Americans has reached its lowest point since Trump won the 2016 presidential election.
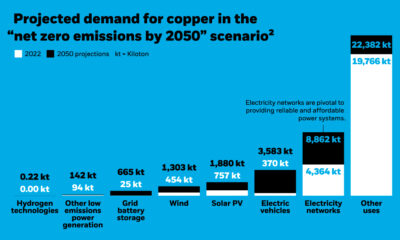

Explore three key insights into the future of the copper market, from soaring demand to potential supply constraints.
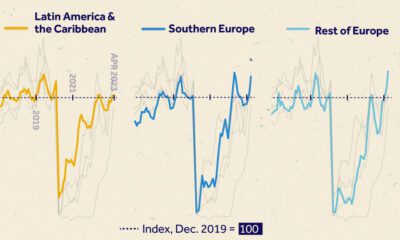

We visualize monthly foreign visitor arrivals, indexed to December 2019, indicating global tourism has all but recovered from COVID-19 disruptions.


 Creator Program