Green
Visualizing the Prolific Plastic Problem in Our Oceans
In February of 2018, a dead sperm whale washed up on along the picturesque shoreline of Cabo de Palos in Spain.
Officials noted that the whale was unusually thin, and a necropsy confirmed that the whale died from an acute abdominal infection. Put simply, the whale ingested so much plastic debris – 67 lbs worth – that its digestive system ruptured.
The Plastic Problem, Visualized
Today’s infographic comes to us from Custom Made, and it helps put the growing marine debris problem in perspective.

A Spiraling Problem
The equivalent of one garbage truck full of plastic enters the sea every minute and the volume of ocean plastic is expected to triple within a decade.
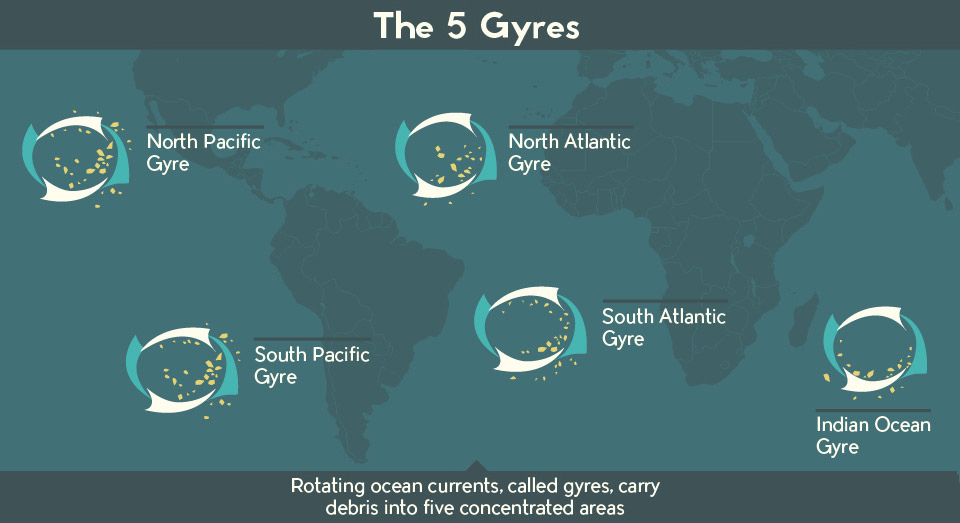
Every stray bit of trash that enters the ocean, from a frayed fishing net off the coast of the Philippines to a plastic bottle cap from an Oakland storm drain, all end up circulating in rotating ocean currents called gyres.
For this reason, the Pacific Gyre is now better known by another name: The Great Pacific Garbage Patch.
The Sum of Many Plastic Parts
The Great Pacific Garbage Patch is often misrepresented online as a literal raft of floating trash stretching as far as the eye can see. The real situation is less visually dramatic, but it’s what we can’t see – microplastic – that’s the biggest problem. Tiny fragments of plastic pose the biggest risks to humans because it’s easy for them to enter the food chain after being ingested by marine life.
While derelict fishing gear such as nets and floats are a contributor to the problem, land-based activity accounts for the majority of the garbage circulating in the ocean. Most of the world’s countries have ocean coastlines, and with so many jurisdictions and varying degrees of environmental scrutiny, truly curbing the flow of plastic isn’t realistic in the near term.
No Solution on the Horizon
Garbage patches have formed deep in the middle of international waters, so there is no clear cut way to decide who is responsible for cleaning up the mess. Organizations like The Ocean Cleanup are researching ocean gyres and providing better insight into the extent of the plastic problem. The Ocean Cleanup is best positioned to make a real impact, though executing on their vision will require vast resources and substantial funding.
Nobody likes seeing whales wash up on shore, but for now, a fully-scaled solution may still far out on the horizon.
Green
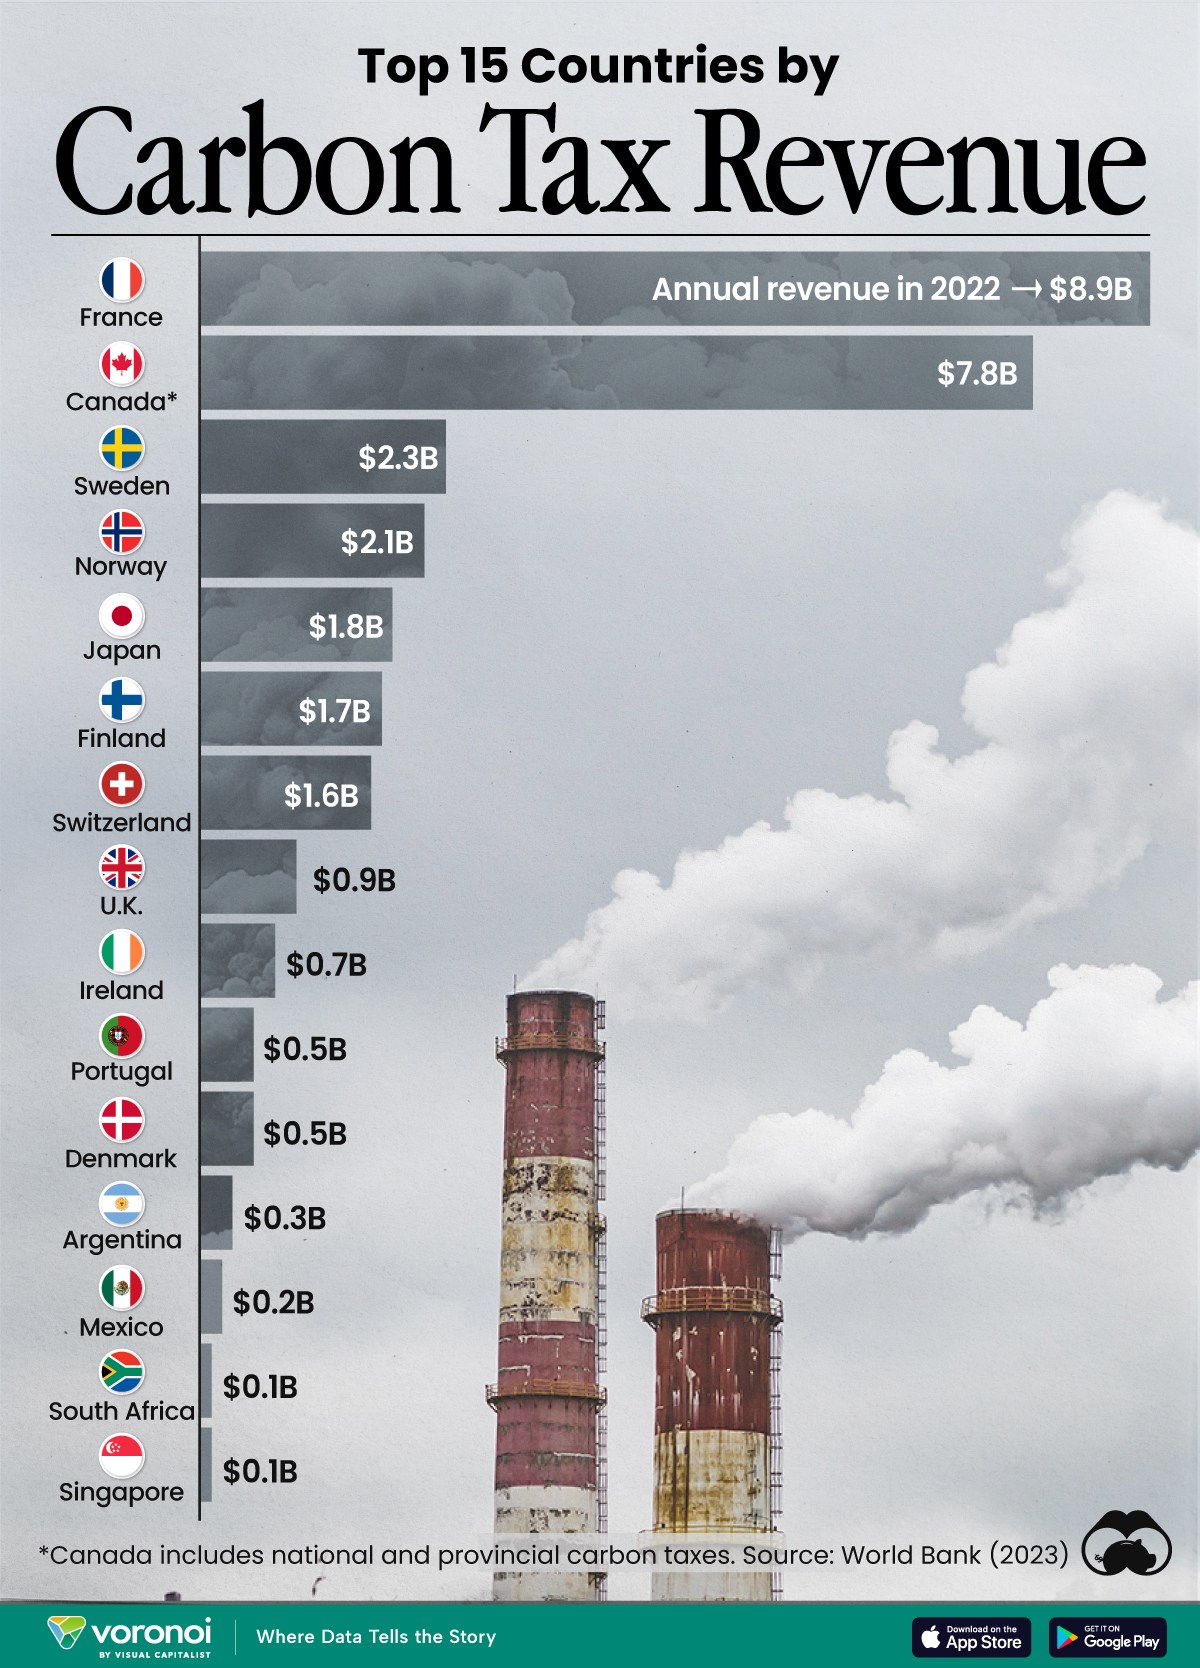
Ranking the Top 15 Countries by Carbon Tax Revenue
This graphic highlights France and Canada as the global leaders when it comes to generating carbon tax revenue.
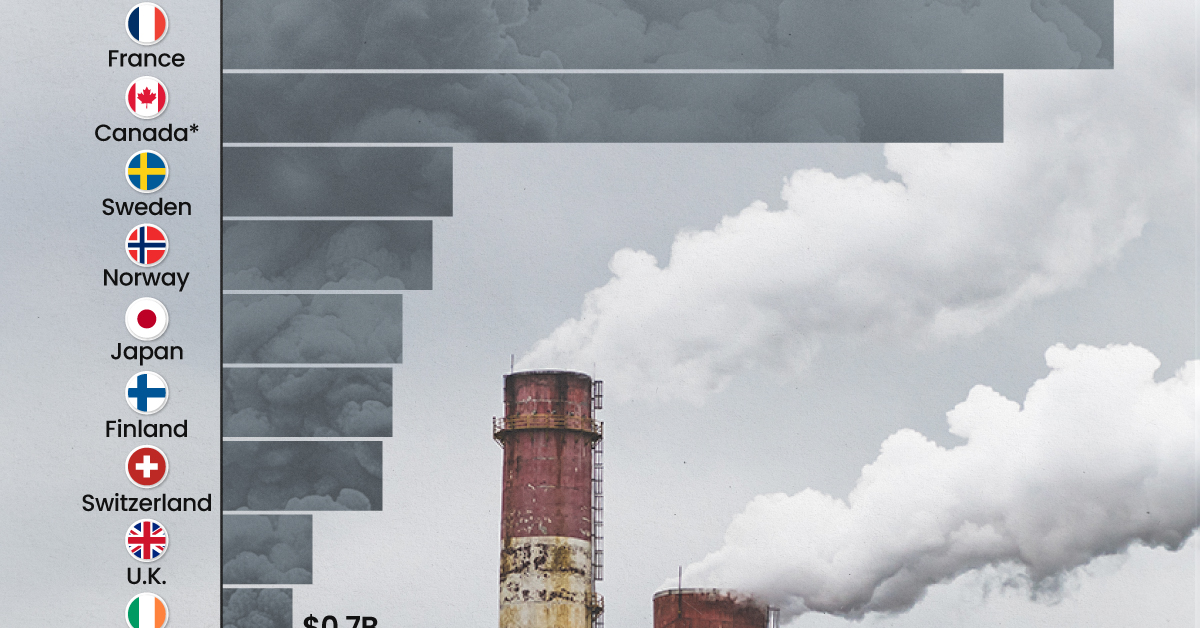
Top 15 Countries by Carbon Tax Revenue
This was originally posted on our Voronoi app. Download the app for free on iOS or Android and discover incredible data-driven charts from a variety of trusted sources.
Carbon taxes are designed to discourage CO2 emissions by increasing the cost of carbon-intensive activities and incentivizing the adoption of cleaner energy alternatives.
In this graphic we list the top 15 countries by carbon tax revenue as of 2022. The data is from the World Bank’s State and Trends of Carbon Pricing Report, published in April 2023.
France and Canada Lead in Global Carbon Tax Revenue
In 2022, the top 15 countries generated approximately $30 billion in revenue from carbon taxes.
France and Canada lead in this regard, accounting for over half of the total amount. Both countries have implemented comprehensive carbon pricing systems that cover a wide range of sectors, including transportation and industry, and they have set relatively high carbon tax rates.
| Country | Government revenue in 2022 ($ billions) |
|---|---|
| 🇫🇷 France | $8.9 |
| 🇨🇦 Canada | $7.8 |
| 🇸🇪 Sweden | $2.3 |
| 🇳🇴 Norway | $2.1 |
| 🇯🇵 Japan | $1.8 |
| 🇫🇮 Finland | $1.7 |
| 🇨🇭 Switzerland | $1.6 |
| 🇬🇧 United Kingdom | $0.9 |
| 🇮🇪 Ireland | $0.7 |
| 🇩🇰 Denmark | $0.5 |
| 🇵🇹 Portugal | $0.5 |
| 🇦🇷 Argentina | $0.3 |
| 🇲🇽 Mexico | $0.2 |
| 🇸🇬 Singapore | $0.1 |
| 🇿🇦 South Africa | $0.1 |
In Canada, the total carbon tax revenue includes both national and provincial taxes.
While carbon pricing has been recognized internationally as one of the more efficient mechanisms for reducing CO2 emissions, research is divided over what the global average carbon price should be to achieve the goals of the Paris Climate Agreement, which aims to limit global warming to 1.5–2°C by 2100 relative to pre-industrial levels.
A recent study has shown that carbon pricing must be supported by other policy measures and innovations. According to a report from Queen’s University, there is no feasible carbon pricing scenario that is high enough to limit emissions sufficiently to achieve anything below 2.4°C warming on its own.
-

 Mining2 weeks ago
Charted: The Value Gap Between the Gold Price and Gold Miners
-

 Real Estate1 week ago
Ranked: The Most Valuable Housing Markets in America
-

 Business1 week ago
Charted: Big Four Market Share by S&P 500 Audits
-

 AI1 week ago
The Stock Performance of U.S. Chipmakers So Far in 2024
-

 Misc1 week ago
Almost Every EV Stock is Down After Q1 2024
-

 Money2 weeks ago
Where Does One U.S. Tax Dollar Go?
-

 Green2 weeks ago
Ranked: Top Countries by Total Forest Loss Since 2001
-

 Real Estate2 weeks ago
Visualizing America’s Shortage of Affordable Homes

