Markets
How Much State Debt Rests on Your Shoulders?
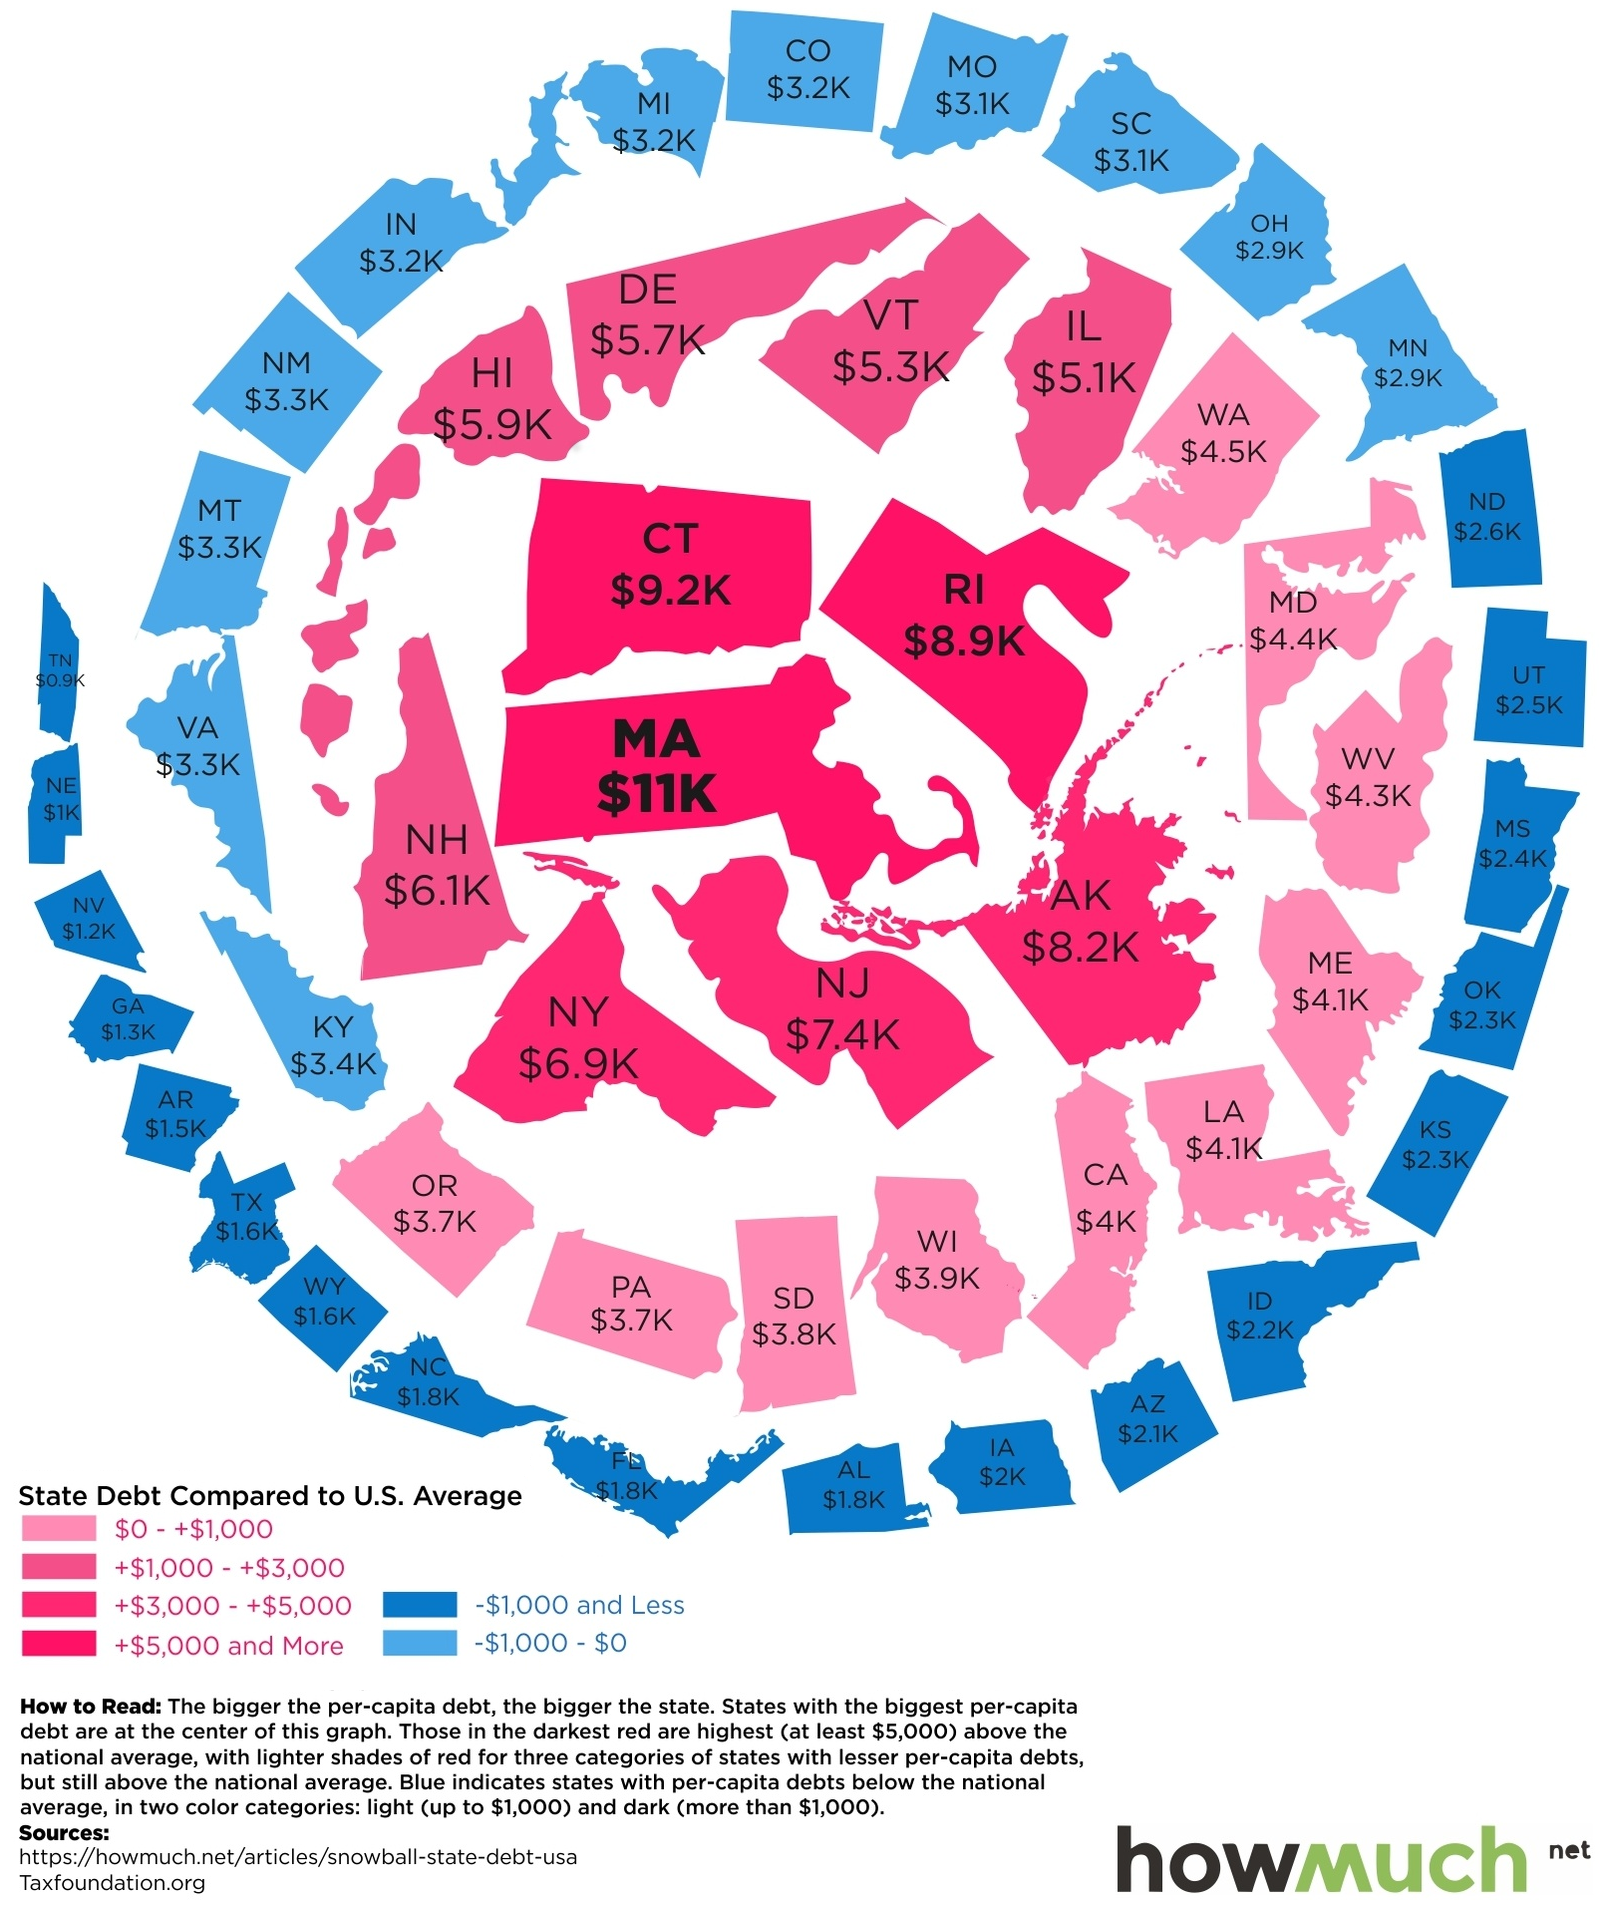
The following “snowball” shows state debt per person in each state:
How Much State Debt Rests on Your Shoulders?
We’ve previously shown the federal government debt incurred per person in each country, but today’s infographic drills down to the state level.
How much state debt is there per person, and why is there such a wide discrepancy between states like Massachusetts ($11,000 per person) and Nebraska ($1,000 per person)?
The Snowball of State Debt
Today’s infographic from HowMuch.net, a cost information site, organizes states by debt per capita using a snowball-like effect.
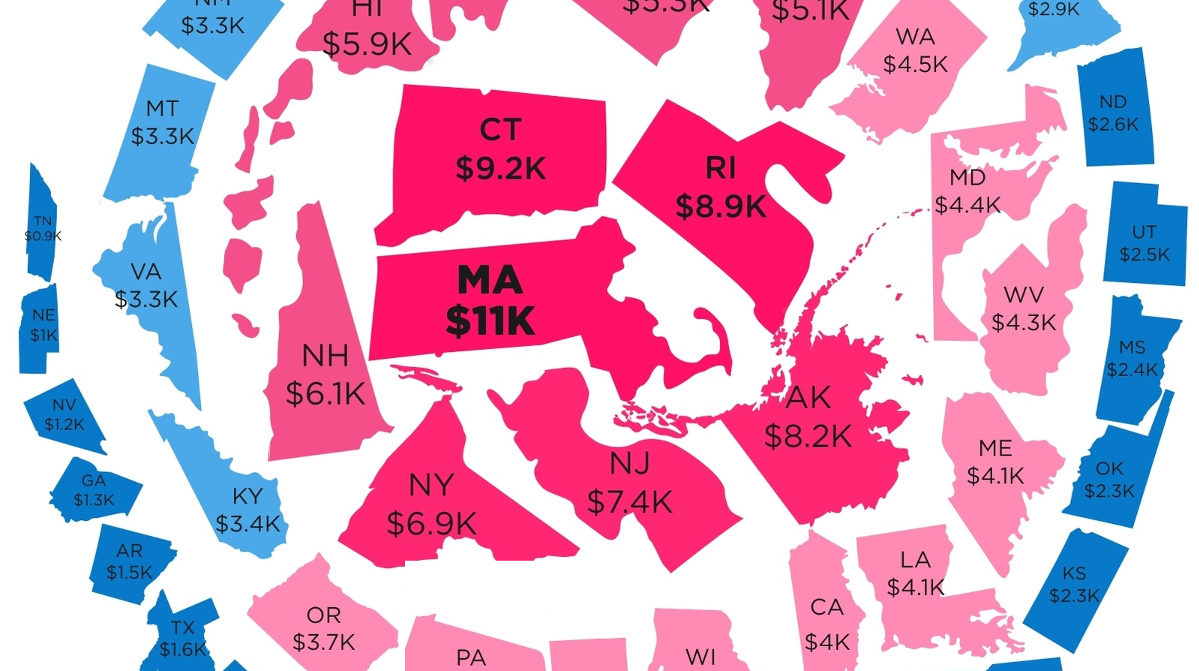
The five states at the center of the snowball with the highest debt per capita are Massachusetts ($11,000), Connecticut ($9,200), Rhode Island ($8,900), Alaska ($8,200), and New Jersey ($7,400).
On the other end of the spectrum are the five states with the lowest state debt per capita: Tennessee ($900), Nebraska ($1,000), Nevada ($1,200), Georgia ($1,300), and Arkansas ($1,500).
While it is reasonable to expect big differences in debt per capita between countries, seeing an interstate difference of up to 10x per person seems a bit perplexing at face value. Let’s see if we can dig a little deeper on what accounts for these differences.
The Curious Case of Massachusetts
Currently, Massachusetts holds the title of the highest state debt per capita, as well as ranking #2 in terms of state debt as a percentage of GDP (14.0%). It’s also worth noting that debt analysts at S&P have recently lowered the outlook on state bonds from stable to negative.
Meanwhile, The Mercatus Center ranked Massachusetts in 49th place in their 2016 State Fiscal Rankings. (The only state to fare worse was Connecticut.)
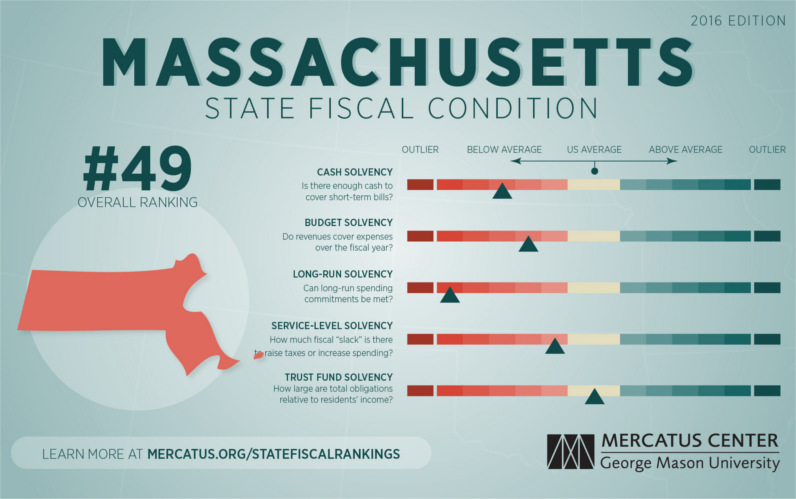
Like other old and urban states, Massachusetts requires significant investments to repair aging roads, schools, and other infrastructure. For many fiscal analysts, however, it is the gap in unfunded liabilities that is the long-term concern.
Forbes notes that unfunded liabilities from public pensions are probably the biggest fiscal problem facing state governments today, and Massachusetts is no exception. Unfunded liabilities in the state are pegged at $94.45 billion with other postemployment benefits (OPEB) at $15.38 billion, and eventually these are issues that will have to be dealt with.
Healthier Budgets
What does a healthier state budget look like? The best examples can be found in the Midwest.
Here’s Nebraska, which has about $1,000 of debt per person:
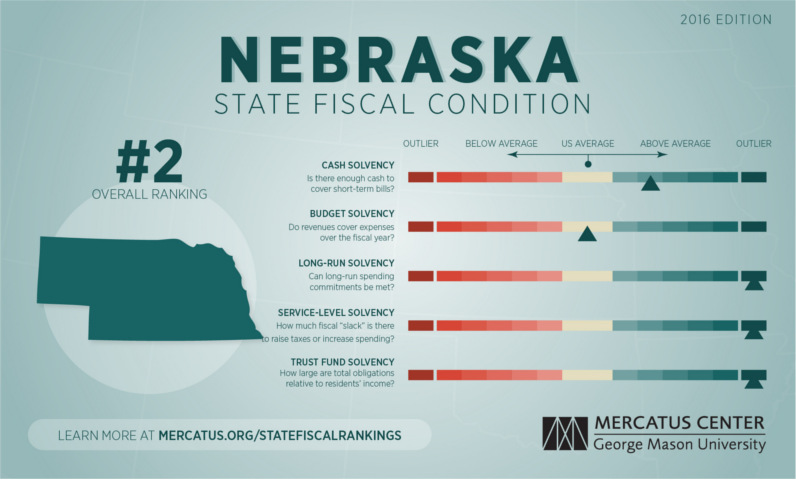
Nebraska exhibits strong fiscal health across all categories. On a cash basis, Nebraska has between 3.81 and 5.02 times the cash needed to cover short-term liabilities. Revenues exceed expenses by 7 percent, producing a surplus of $294 per capita.
– Mercatus Center at George Mason University


Economy
Economic Growth Forecasts for G7 and BRICS Countries in 2024
The IMF has released its economic growth forecasts for 2024. How do the G7 and BRICS countries compare?


G7 & BRICS Real GDP Growth Forecasts for 2024
The International Monetary Fund’s (IMF) has released its real gross domestic product (GDP) growth forecasts for 2024, and while global growth is projected to stay steady at 3.2%, various major nations are seeing declining forecasts.
This chart visualizes the 2024 real GDP growth forecasts using data from the IMF’s 2024 World Economic Outlook for G7 and BRICS member nations along with Saudi Arabia, which is still considering an invitation to join the bloc.
Get the Key Insights of the IMF’s World Economic Outlook
Want a visual breakdown of the insights from the IMF’s 2024 World Economic Outlook report?
This visual is part of a special dispatch of the key takeaways exclusively for VC+ members.
Get the full dispatch of charts by signing up to VC+.
Mixed Economic Growth Prospects for Major Nations in 2024
Economic growth projections by the IMF for major nations are mixed, with the majority of G7 and BRICS countries forecasted to have slower growth in 2024 compared to 2023.
Only three BRICS-invited or member countries, Saudi Arabia, the UAE, and South Africa, have higher projected real GDP growth rates in 2024 than last year.
| Group | Country | Real GDP Growth (2023) | Real GDP Growth (2024P) |
|---|---|---|---|
| G7 | 🇺🇸 U.S. | 2.5% | 2.7% |
| G7 | 🇨🇦 Canada | 1.1% | 1.2% |
| G7 | 🇯🇵 Japan | 1.9% | 0.9% |
| G7 | 🇫🇷 France | 0.9% | 0.7% |
| G7 | 🇮🇹 Italy | 0.9% | 0.7% |
| G7 | 🇬🇧 UK | 0.1% | 0.5% |
| G7 | 🇩🇪 Germany | -0.3% | 0.2% |
| BRICS | 🇮🇳 India | 7.8% | 6.8% |
| BRICS | 🇨🇳 China | 5.2% | 4.6% |
| BRICS | 🇦🇪 UAE | 3.4% | 3.5% |
| BRICS | 🇮🇷 Iran | 4.7% | 3.3% |
| BRICS | 🇷🇺 Russia | 3.6% | 3.2% |
| BRICS | 🇪🇬 Egypt | 3.8% | 3.0% |
| BRICS-invited | 🇸🇦 Saudi Arabia | -0.8% | 2.6% |
| BRICS | 🇧🇷 Brazil | 2.9% | 2.2% |
| BRICS | 🇿🇦 South Africa | 0.6% | 0.9% |
| BRICS | 🇪🇹 Ethiopia | 7.2% | 6.2% |
| 🌍 World | 3.2% | 3.2% |
China and India are forecasted to maintain relatively high growth rates in 2024 at 4.6% and 6.8% respectively, but compared to the previous year, China is growing 0.6 percentage points slower while India is an entire percentage point slower.
On the other hand, four G7 nations are set to grow faster than last year, which includes Germany making its comeback from its negative real GDP growth of -0.3% in 2023.
Faster Growth for BRICS than G7 Nations
Despite mostly lower growth forecasts in 2024 compared to 2023, BRICS nations still have a significantly higher average growth forecast at 3.6% compared to the G7 average of 1%.
While the G7 countries’ combined GDP is around $15 trillion greater than the BRICS nations, with continued higher growth rates and the potential to add more members, BRICS looks likely to overtake the G7 in economic size within two decades.
BRICS Expansion Stutters Before October 2024 Summit
BRICS’ recent expansion has stuttered slightly, as Argentina’s newly-elected president Javier Milei declined its invitation and Saudi Arabia clarified that the country is still considering its invitation and has not joined BRICS yet.
Even with these initial growing pains, South Africa’s Foreign Minister Naledi Pandor told reporters in February that 34 different countries have submitted applications to join the growing BRICS bloc.
Any changes to the group are likely to be announced leading up to or at the 2024 BRICS summit which takes place October 22-24 in Kazan, Russia.
Get the Full Analysis of the IMF’s Outlook on VC+
This visual is part of an exclusive special dispatch for VC+ members which breaks down the key takeaways from the IMF’s 2024 World Economic Outlook.
For the full set of charts and analysis, sign up for VC+.

-

 Markets1 week ago
U.S. Debt Interest Payments Reach $1 Trillion
-

 Markets2 weeks ago
Ranked: The Most Valuable Housing Markets in America
-

 Money2 weeks ago
Which States Have the Highest Minimum Wage in America?
-

 AI2 weeks ago
Ranked: Semiconductor Companies by Industry Revenue Share
-

 Markets2 weeks ago
Ranked: The World’s Top Flight Routes, by Revenue
-

 Countries2 weeks ago
Population Projections: The World’s 6 Largest Countries in 2075
-

 Markets2 weeks ago
The Top 10 States by Real GDP Growth in 2023
-

 Money2 weeks ago
The Smallest Gender Wage Gaps in OECD Countries