Markets
Millennials are Investing With a Purpose, and It’s Changing Wealth Management
Millennials Investing With a Purpose
22% of Total AUM in U.S. are Sustainable Investments
The Chart of the Week is a weekly Visual Capitalist feature on Fridays.
If you’ve been paying attention to your social media feeds or most news outlets, it should be pretty clear to you that millennials seem to be “killing” just about everything – from Applebee’s to the entire golf industry.
While this “killing” meme is obviously a ridiculous hyperbole, there is at least some truth to it.
As the largest generation in American history, millennials are gaining sway and buying power quickly – and businesses that do not take heed to their preferences could feel the burn. Even worse, over the long run, some industries and businesses may go the way of the dodo.
The Rise of Sustainable Investing
The latest thing that millennials are “killing”? It’s the act of investing solely just for financial returns.
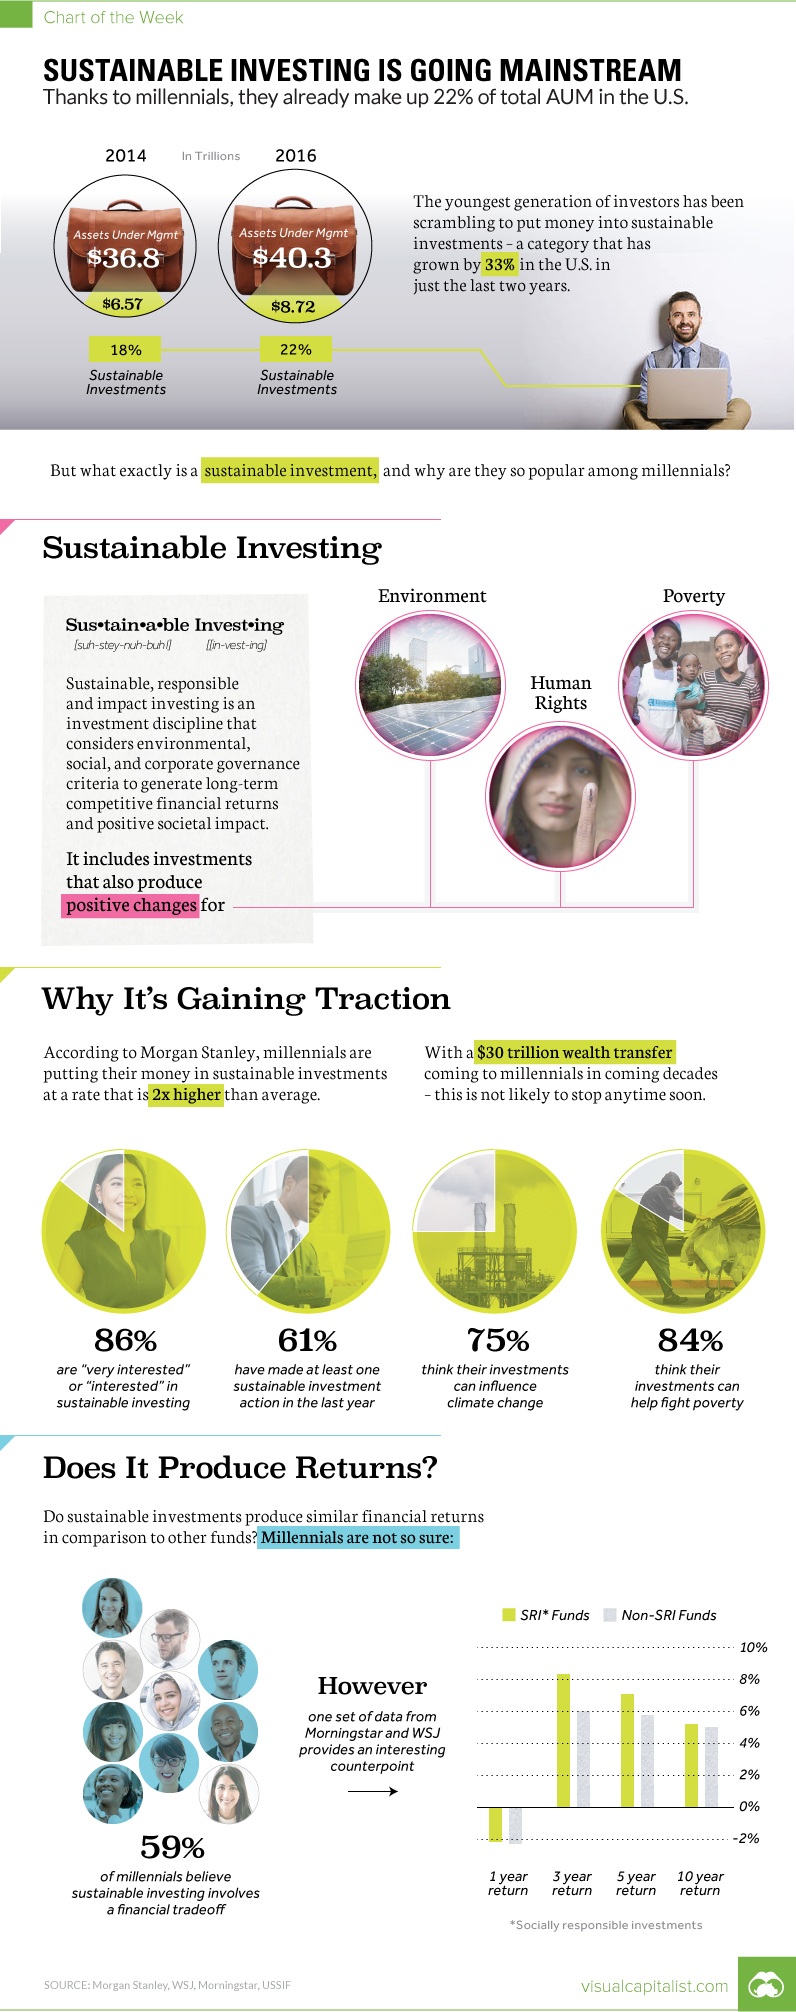
There’s mounting evidence that millennials are putting their money towards investments that have another component: making a positive societal impact. This practice is called sustainable investing, and it considers criteria around environmental, social, and corporate governance for investments in addition to the aspect of financial returns.
Put another way, many millennials want to put their money towards companies and funds that are helping to do things like alleviate poverty, protect the environment, or further human rights around the world. They want to generate ROI in both financial and social spheres.
Proof in the Pudding
Over the last decade or so, the amount of assets under management (AUM) for sustainable investments has ballooned to a whopping $8.72 trillion in the U.S. for 2016:
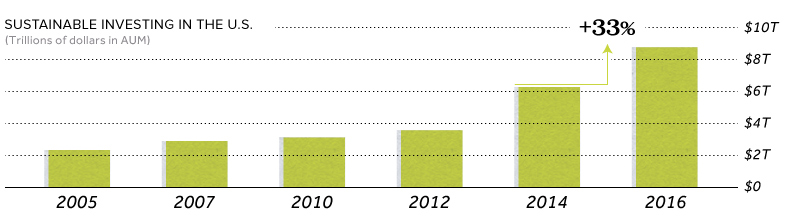
Since 2014, that’s a 33% increase – and even more interestingly, sustainable investments now make up 22% of the $40.3 trillion of total AUM in the United States.
Why is sustainable investing so popular among millennials? Here’s a rundown, mostly coming from recent research from Morgan Stanley:
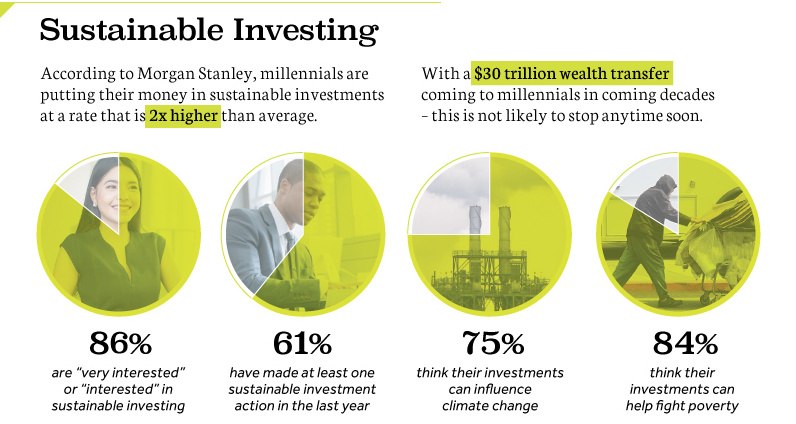
- Millennials are putting money in sustainable investments at a rate 2x higher than average.
- 86% of millennial investors say they are “very interested” or “interested” in sustainable investing.
- 61% have made at least one sustainable investment action in the last year.
- 75% think their investments can influence climate change.
- 84% think their investments can help fight poverty.
And with a $30 trillion wealth transfer coming to millennials over the coming decades, this preference of using investments as a vehicle for creating positive social change is more than just a trend.
The Big Question
There does remain one big question that millennials and wealth managers are focused on: do sustainable investments provide similar financial returns to regular investments?
Millennials are willing to take a risk that they don’t – in fact, Morgan Stanley found that 59% of millennials believe that there is a trade-off between social impact and financial returns.
Interestingly, some data is already providing a counterpoint to this narrative. In a report from Morningstar and WSJ, for example, it’s shown that funds focused on sustainable investments have offered superior performance to non-sustainable investments over periods of one, three, five, and 10 years.
Whether this stays true for the future remains to be seen – but it will be an important and fun metric to watch.


Markets
U.S. Debt Interest Payments Reach $1 Trillion
U.S. debt interest payments have surged past the $1 trillion dollar mark, amid high interest rates and an ever-expanding debt burden.


U.S. Debt Interest Payments Reach $1 Trillion
This was originally posted on our Voronoi app. Download the app for free on iOS or Android and discover incredible data-driven charts from a variety of trusted sources.
The cost of paying for America’s national debt crossed the $1 trillion dollar mark in 2023, driven by high interest rates and a record $34 trillion mountain of debt.
Over the last decade, U.S. debt interest payments have more than doubled amid vast government spending during the pandemic crisis. As debt payments continue to soar, the Congressional Budget Office (CBO) reported that debt servicing costs surpassed defense spending for the first time ever this year.
This graphic shows the sharp rise in U.S. debt payments, based on data from the Federal Reserve.
A $1 Trillion Interest Bill, and Growing
Below, we show how U.S. debt interest payments have risen at a faster pace than at another time in modern history:
| Date | Interest Payments | U.S. National Debt |
|---|---|---|
| 2023 | $1.0T | $34.0T |
| 2022 | $830B | $31.4T |
| 2021 | $612B | $29.6T |
| 2020 | $518B | $27.7T |
| 2019 | $564B | $23.2T |
| 2018 | $571B | $22.0T |
| 2017 | $493B | $20.5T |
| 2016 | $460B | $20.0T |
| 2015 | $435B | $18.9T |
| 2014 | $442B | $18.1T |
| 2013 | $425B | $17.2T |
| 2012 | $417B | $16.4T |
| 2011 | $433B | $15.2T |
| 2010 | $400B | $14.0T |
| 2009 | $354B | $12.3T |
| 2008 | $380B | $10.7T |
| 2007 | $414B | $9.2T |
| 2006 | $387B | $8.7T |
| 2005 | $355B | $8.2T |
| 2004 | $318B | $7.6T |
| 2003 | $294B | $7.0T |
| 2002 | $298B | $6.4T |
| 2001 | $318B | $5.9T |
| 2000 | $353B | $5.7T |
| 1999 | $353B | $5.8T |
| 1998 | $360B | $5.6T |
| 1997 | $368B | $5.5T |
| 1996 | $362B | $5.3T |
| 1995 | $357B | $5.0T |
| 1994 | $334B | $4.8T |
| 1993 | $311B | $4.5T |
| 1992 | $306B | $4.2T |
| 1991 | $308B | $3.8T |
| 1990 | $298B | $3.4T |
| 1989 | $275B | $3.0T |
| 1988 | $254B | $2.7T |
| 1987 | $240B | $2.4T |
| 1986 | $225B | $2.2T |
| 1985 | $219B | $1.9T |
| 1984 | $205B | $1.7T |
| 1983 | $176B | $1.4T |
| 1982 | $157B | $1.2T |
| 1981 | $142B | $1.0T |
| 1980 | $113B | $930.2B |
| 1979 | $96B | $845.1B |
| 1978 | $84B | $789.2B |
| 1977 | $69B | $718.9B |
| 1976 | $61B | $653.5B |
| 1975 | $55B | $576.6B |
| 1974 | $50B | $492.7B |
| 1973 | $45B | $469.1B |
| 1972 | $39B | $448.5B |
| 1971 | $36B | $424.1B |
| 1970 | $35B | $389.2B |
| 1969 | $30B | $368.2B |
| 1968 | $25B | $358.0B |
| 1967 | $23B | $344.7B |
| 1966 | $21B | $329.3B |
Interest payments represent seasonally adjusted annual rate at the end of Q4.
At current rates, the U.S. national debt is growing by a remarkable $1 trillion about every 100 days, equal to roughly $3.6 trillion per year.
As the national debt has ballooned, debt payments even exceeded Medicaid outlays in 2023—one of the government’s largest expenditures. On average, the U.S. spent more than $2 billion per day on interest costs last year. Going further, the U.S. government is projected to spend a historic $12.4 trillion on interest payments over the next decade, averaging about $37,100 per American.
Exacerbating matters is that the U.S. is running a steep deficit, which stood at $1.1 trillion for the first six months of fiscal 2024. This has accelerated due to the 43% increase in debt servicing costs along with a $31 billion dollar increase in defense spending from a year earlier. Additionally, a $30 billion increase in funding for the Federal Deposit Insurance Corporation in light of the regional banking crisis last year was a major contributor to the deficit increase.
Overall, the CBO forecasts that roughly 75% of the federal deficit’s increase will be due to interest costs by 2034.

-

 Real Estate2 weeks ago
Visualizing America’s Shortage of Affordable Homes
-

 Technology1 week ago
Ranked: Semiconductor Companies by Industry Revenue Share
-

 Money1 week ago
Which States Have the Highest Minimum Wage in America?
-

 Real Estate1 week ago
Ranked: The Most Valuable Housing Markets in America
-

 Business2 weeks ago
Charted: Big Four Market Share by S&P 500 Audits
-

 AI2 weeks ago
The Stock Performance of U.S. Chipmakers So Far in 2024
-

 Misc2 weeks ago
Almost Every EV Stock is Down After Q1 2024
-

 Money2 weeks ago
Where Does One U.S. Tax Dollar Go?