Misc
Millennial Entrepreneurs: America’s Best or Worst Entrepreneurial Generation?
Millennial Entrepreneurs: America’s Best or Worst Entrepreneurial Generation?
Deciding to put it all on the line as an entrepreneur is a complex decision that depends on many variables. It’s a psychological decision. It’s a financial decision. It’s a decision based on the perception of risks and the potential payoff. It’s a family and societal decision: is it better to just toe the line to ensure a steady family income, or will there be no support in the event of failure?
Strictly by definition, every generation is different. We’re shaped by the culture, technology, values, and events of our times, and it is constantly in flux. This relates to something as nuanced as entrepreneurship, as it is highly dependent on people’s attitudes and the financial opportunity of the time.
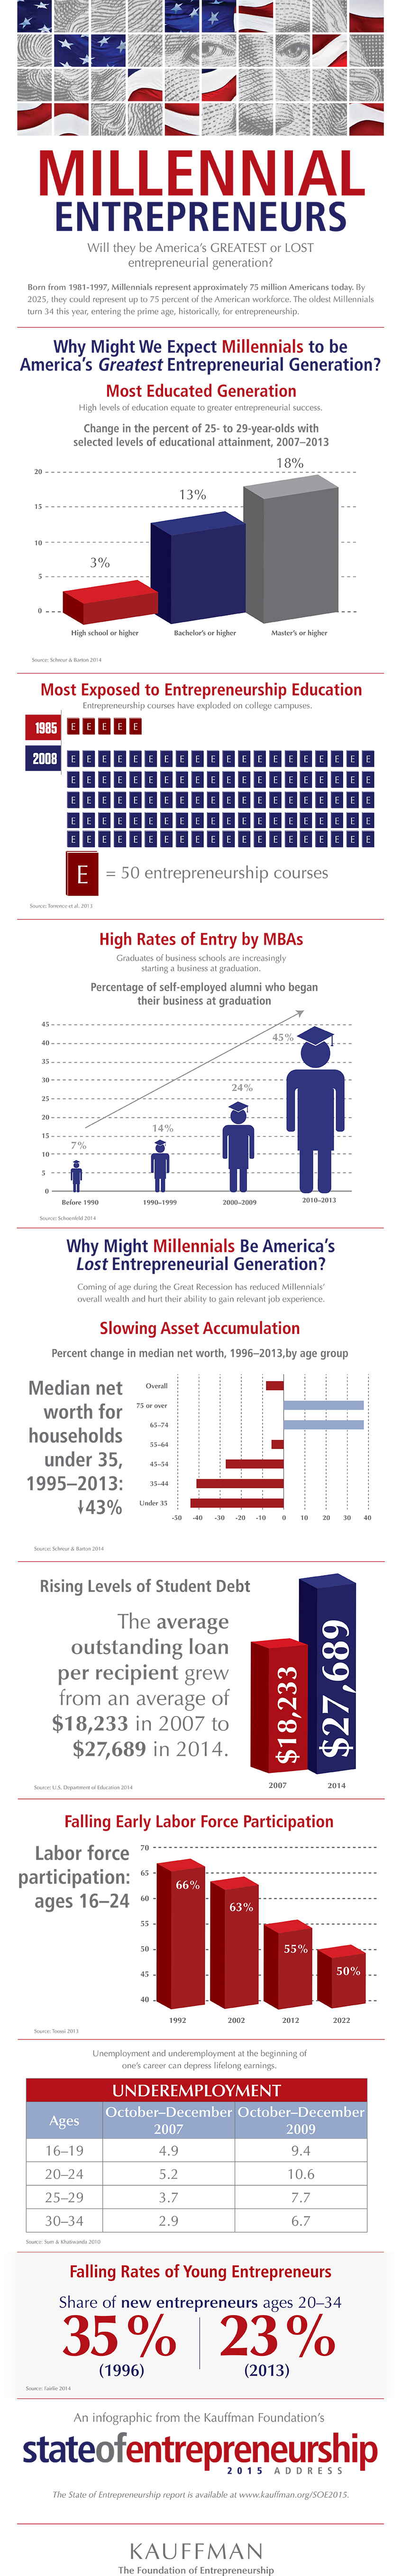
Millennials, many born in the 1980s, are entering their prime years for entrepreneurship right now. Today’s infographic compiles some of the statistics and attitudes on millennials regarding starting a business.
It turns out that the data points both ways.
Millennials could be the best entrepreneurial generation based mainly on education and technology. The millennials are the most educated generation, and many are taking MBAs as well as taking entrepreneurship courses. Further, the technology of today allows companies to startup especially in areas of technology for very little capital.
Millennials could also be a lost entrepreneurial generation based on their personal finances and lack of employment experience or participation. The average amount of outstanding loans is growing for young people, and median wealth for young people is going down, not up. Even worse, many millennials still have trouble getting jobs. Labour force participation for people aged 16-24 dropped from 66% to 55% over the last 20 years. There’s also less entrepreneurs aged 20-34 today than in previous years. In 1996, 35% of people in that group were entrepreneurs. Today it is 23%.
As a positive caveat, technology has allowed more young entrepreneurs than every before to amass great amounts of wealth through startups such as Facebook, Snapchat, and other tech businesses.
Original graphic from: State of Entrepreneurship 2015


Misc
How Hard Is It to Get Into an Ivy League School?
We detail the admission rates and average annual cost for Ivy League schools, as well as the median SAT scores required to be accepted.


How Hard Is It to Get Into an Ivy League School?
This was originally posted on our Voronoi app. Download the app for free on iOS or Android and discover incredible data-driven charts from a variety of trusted sources.
Ivy League institutions are renowned worldwide for their academic excellence and long-standing traditions. But how hard is it to get into one of the top universities in the U.S.?
In this graphic, we detail the admission rates and average annual cost for Ivy League schools, as well as the median SAT scores required to be accepted. The data comes from the National Center for Education Statistics and was compiled by 24/7 Wall St.
Note that “average annual cost” represents the net price a student pays after subtracting the average value of grants and/or scholarships received.
Harvard is the Most Selective
The SAT is a standardized test commonly used for college admissions in the United States. It’s taken by high school juniors and seniors to assess their readiness for college-level academic work.
When comparing SAT scores, Harvard and Dartmouth are among the most challenging universities to gain admission to. The median SAT scores for their students are 760 for reading and writing and 790 for math. Still, Harvard has half the admission rate (3.2%) compared to Dartmouth (6.4%).
| School | Admission rate (%) | SAT Score: Reading & Writing | SAT Score: Math | Avg Annual Cost* |
|---|---|---|---|---|
| Harvard University | 3.2 | 760 | 790 | $13,259 |
| Columbia University | 3.9 | 750 | 780 | $12,836 |
| Yale University | 4.6 | 760 | 780 | $16,341 |
| Brown University | 5.1 | 760 | 780 | $26,308 |
| Princeton University | 5.7 | 760 | 780 | $11,080 |
| Dartmouth College | 6.4 | 760 | 790 | $33,023 |
| University of Pennsylvania | 6.5 | 750 | 790 | $14,851 |
| Cornell University | 7.5 | 750 | 780 | $29,011 |
*Costs after receiving federal financial aid.
Additionally, Dartmouth has the highest average annual cost at $33,000. Princeton has the lowest at $11,100.
While student debt has surged in the United States in recent years, hitting $1.73 trillion in 2023, the worth of obtaining a degree from any of the schools listed surpasses mere academics. This is evidenced by the substantial incomes earned by former students.
Harvard grads, for example, have the highest average starting salary in the country, at $91,700.

-

 Green2 weeks ago
Ranked: Top Countries by Total Forest Loss Since 2001
-

 Travel1 week ago
Ranked: The World’s Top Flight Routes, by Revenue
-

 Technology1 week ago
Ranked: Semiconductor Companies by Industry Revenue Share
-

 Money2 weeks ago
Which States Have the Highest Minimum Wage in America?
-

 Real Estate2 weeks ago
Ranked: The Most Valuable Housing Markets in America
-

 Markets2 weeks ago
Charted: Big Four Market Share by S&P 500 Audits
-

 AI2 weeks ago
The Stock Performance of U.S. Chipmakers So Far in 2024
-

 Automotive2 weeks ago
Almost Every EV Stock is Down After Q1 2024