Misc
Commuters and Computers: Mapping U.S. Megaregions
Commuters and Computers: Mapping U.S. Megaregions
From California’s Bay Area to the highly-integrated Great Lakes Economy, megaregions are a dominating aspect of human geography and commerce. It should be no surprise then, that 85% of corporate head offices in the US and Canada are overwhelmingly concentrated in the core cities of great megaregions.
We tend to think of cities as individual economic units, but as they expand outward and bleed together, defining them simply by official jurisdictions and borders becomes difficult. After all, many of the imaginary lines divvying up the country are remnants of decisions from centuries ago – and other county and state lines exist for more counterintuitive reasons such as gerrymandering.
What if there was a more data-driven approach to examine America’s urban networks?
Computer, Take The Wheel
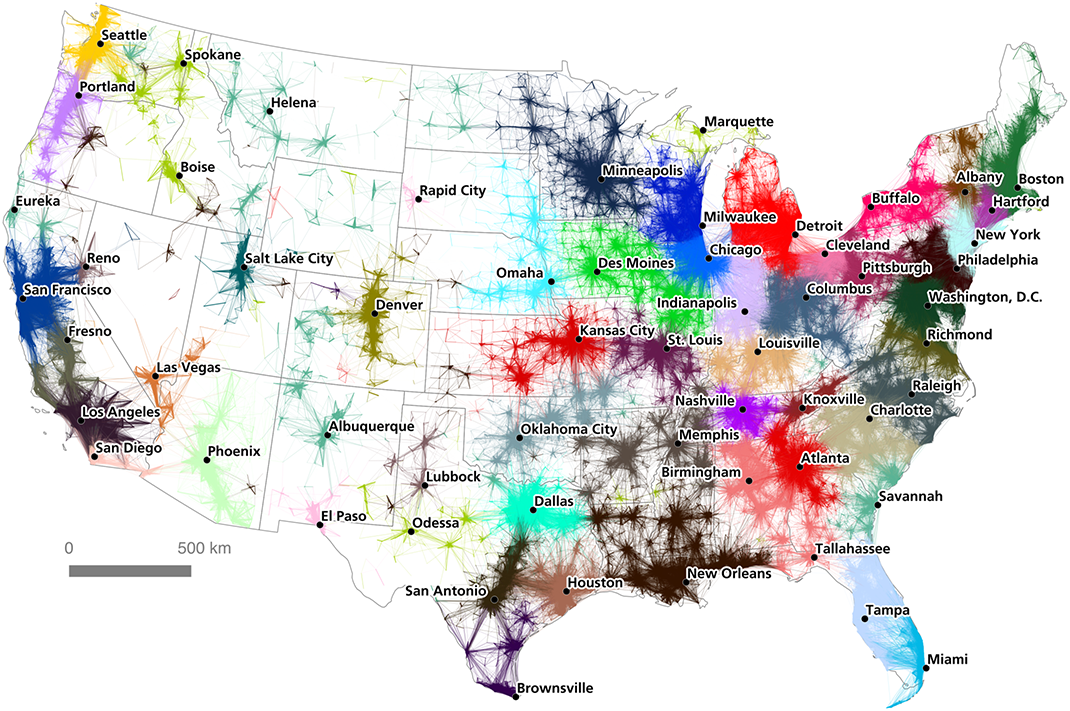
By ignoring borders and looking purely at commuter data, geographer Garrett Nelson and urban analyst Alasdair Rae looked to map the relationship between population centers in their paper, An Economic Geography of the United States: From Commutes to Mega-regions.
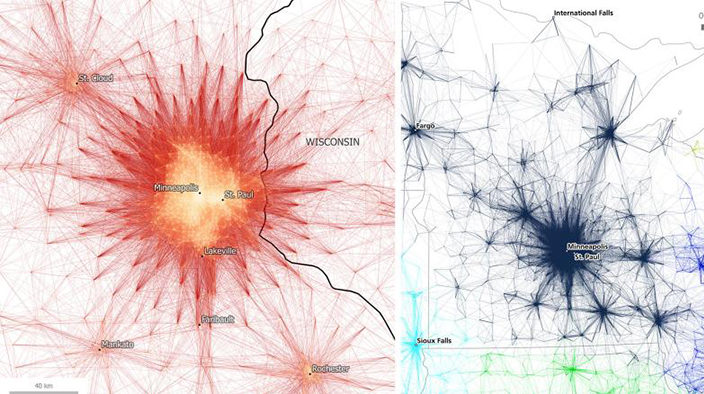
Researchers used visual and algorithmic approaches to build their map.
The study used network partitioning software to link together 4 million commutes between census tracts. This gives us a very granular look at the “gravitational pull” of America’s population centers, and helps us better understand the economic links that bind a region together.
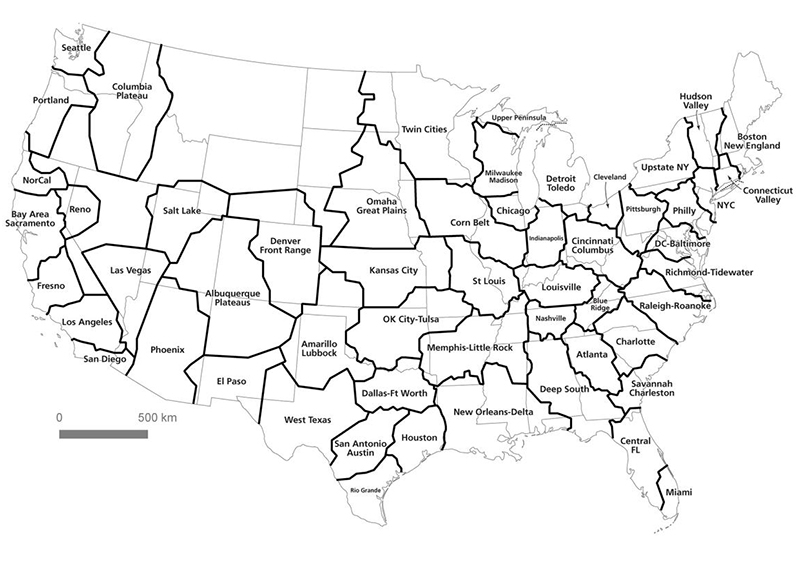
By combining visual and mathematical approaches, and some creative place-naming, the researchers created a map that they hope reflects America’s true economic geography.
Algorithmic Insights
The concept of megaregions is hardly new, and there are already definitions for global megacities that use everything from infrastructure systems to light patterns derived from satellite imagery.
That said, this research is fine example of using data and an algorithmic approach to look at systems in a new way, unburdened by our political and cultural preconceptions.


Maps
The Largest Earthquakes in the New York Area (1970-2024)
The earthquake that shook buildings across New York in April 2024 was the third-largest quake in the Northeast U.S. over the past 50 years.


The Largest Earthquakes in the New York Area
This was originally posted on our Voronoi app. Download the app for free on Apple or Android and discover incredible data-driven charts from a variety of trusted sources.
The 4.8 magnitude earthquake that shook buildings across New York on Friday, April 5th, 2024 was the third-largest quake in the U.S. Northeast area over the past 50 years.
In this map, we illustrate earthquakes with a magnitude of 4.0 or greater recorded in the Northeastern U.S. since 1970, according to the United States Geological Survey (USGS).
Shallow Quakes and Older Buildings
The earthquake that struck the U.S. Northeast in April 2024 was felt by millions of people from Washington, D.C., to north of Boston. It even caused a full ground stop at Newark Airport.
The quake, occurring just 5 km beneath the Earth’s surface, was considered shallow, which is what contributed to more intense shaking at the surface.
According to the USGS, rocks in the eastern U.S. are significantly older, denser, and harder than those on the western side, compressed by time. This makes them more efficient conduits for seismic energy. Additionally, buildings in the Northeast tend to be older and may not adhere to the latest earthquake codes.
Despite disrupting work and school life, the earthquake was considered minor, according to the Michigan Technological University magnitude scale:
| Magnitude | Earthquake Effects | Estimated Number Each Year |
|---|---|---|
| 2.5 or less | Usually not felt, but can be recorded by seismograph. | Millions |
| 2.5 to 5.4 | Often felt, but only causes minor damage. | 500,000 |
| 5.5 to 6.0 | Slight damage to buildings and other structures. | 350 |
| 6.1 to 6.9 | May cause a lot of damage in very populated areas. | 100 |
| 7.0 to 7.9 | Major earthquake. Serious damage. | 10-15 |
| 8.0 or greater | Great earthquake. Can totally destroy communities near the epicenter. | One every year or two |
The largest earthquake felt in the area over the past 50 years was a 5.3 magnitude quake that occurred in Au Sable Forks, New York, in 2002. It damaged houses and cracked roads in a remote corner of the Adirondack Mountains, but caused no injuries.
| Date | Magnitude | Location | State |
|---|---|---|---|
| April 20, 2002 | 5.3 | Au Sable Forks | New York |
| October 7, 1983 | 5.1 | Newcomb | New York |
| April 5, 2024 | 4.8 | Whitehouse Station | New Jersey |
| October 16, 2012 | 4.7 | Hollis Center | Maine |
| January 16, 1994 | 4.6 | Sinking Spring | Pennsylvania |
| January 19, 1982 | 4.5 | Sanbornton | New Hampshire |
| September 25, 1998 | 4.5 | Adamsville | Pennsylvania |
| June 9, 1975 | 4.2 | Altona | New York |
| May 29, 1983 | 4.2 | Peru | Maine |
| April 23, 1984 | 4.2 | Conestoga | Pennsylvania |
| January 16, 1994 | 4.2 | Sinking Spring | Pennsylvania |
| November 3, 1975 | 4 | Long Lake | New York |
| June 17, 1991 | 4 | Worcester | New York |
The largest earthquake in U.S. history, however, was the 1964 Good Friday quake in Alaska, measuring 9.2 magnitude and killing 131 people.

-
 Money2 weeks ago
Visualizing the Growth of $100, by Asset Class (1970-2023)
-

 Money1 week ago
Where Does One U.S. Tax Dollar Go?
-

 Green2 weeks ago
Ranked: Top Countries by Total Forest Loss Since 2001
-

 Real Estate2 weeks ago
Visualizing America’s Shortage of Affordable Homes
-

 Maps2 weeks ago
Mapped: Average Wages Across Europe
-

 Mining2 weeks ago
Charted: The Value Gap Between the Gold Price and Gold Miners
-

 Demographics2 weeks ago
Visualizing the Size of the Global Senior Population
-

 Automotive2 weeks ago
Tesla Is Once Again the World’s Best-Selling EV Company