Energy
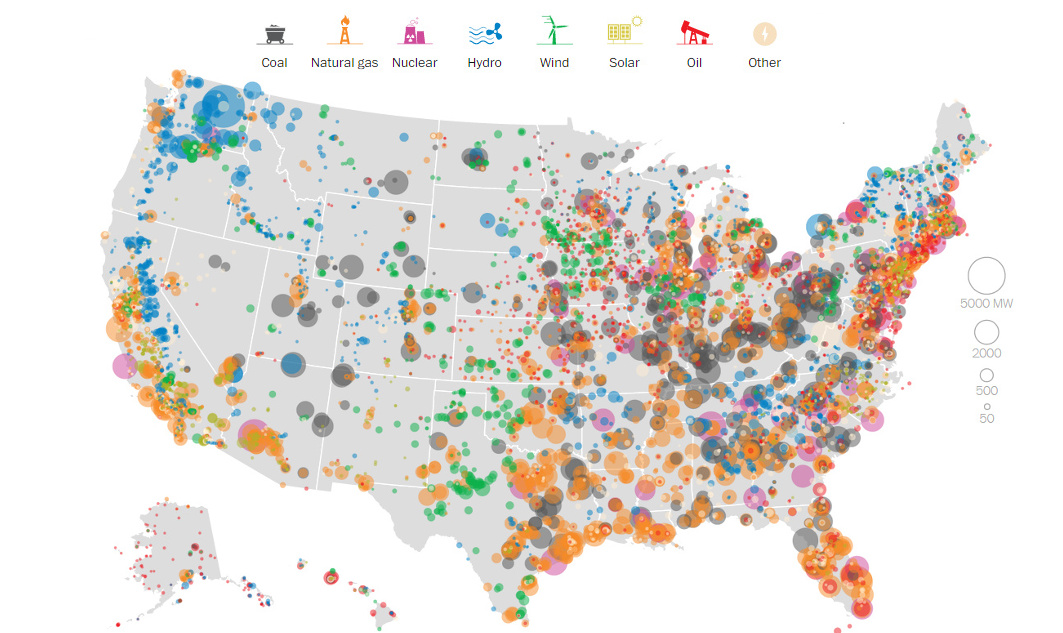
Mapping Every Power Plant in the United States
Note: Updated to reflect 2017 numbers
The Washington Post has put together an extraordinary data visualization that shows how the United States has generated its electricity so far this year. Using data from the Energy Information Administration, they have mapped every power source and categorized it by type and size.
Related Topic: What it Takes to Power New York (Slideshow)
I will recap the most interesting parts of their project here, but we highly recommend that you visit their online interactive version of this visualization to get the most out of their work.
Plant Capacity by Megawatt
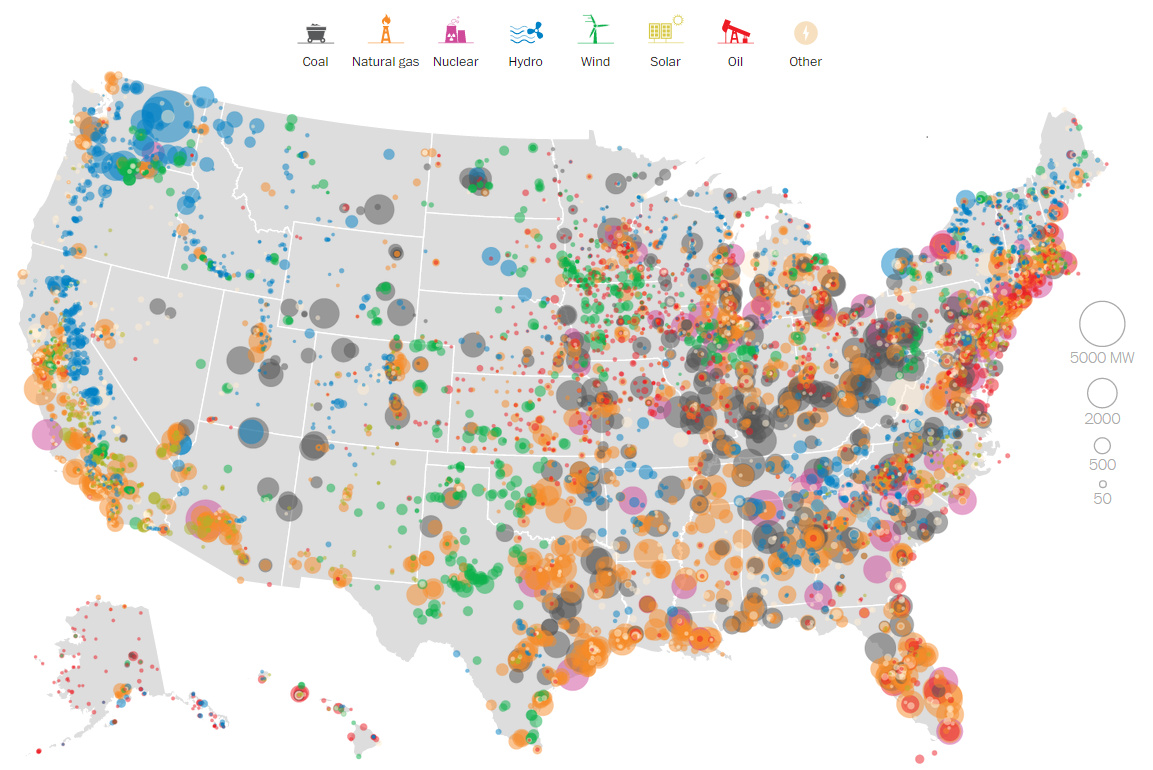
This above visualization is a little overwhelming, as it includes every power source in America. However, later on we will show various visualizations by power type, which make it easier to make sense of.
Power Generated by Source: Coal
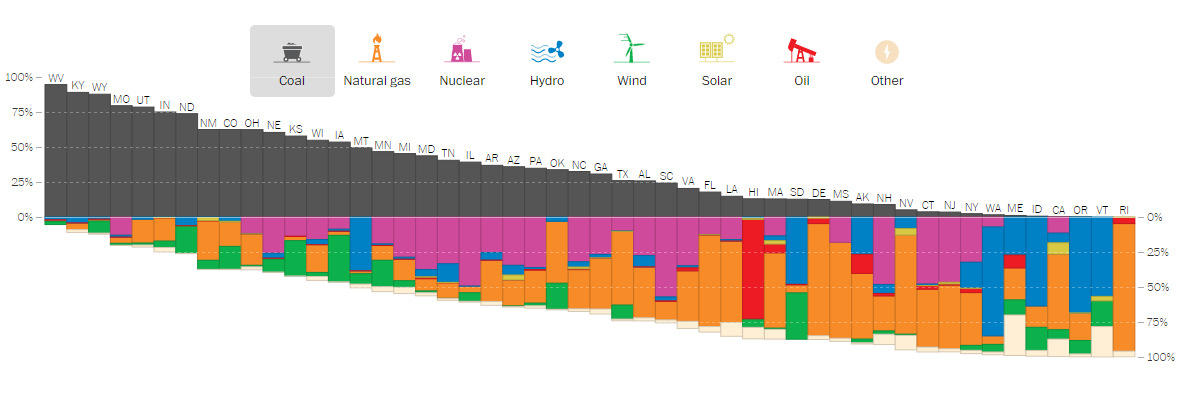
Data visualized like this shows there is still a large reliance on specific energy types such as coal, hydro, and nuclear. For example, in 2017, 27 states still rely on coal to produce at least 25% of their electricity.
Meanwhile, the following chart on solar shows how far photovoltaics still have to go to make a significant impact in the overall energy mix.
Power Generated by Source: Solar
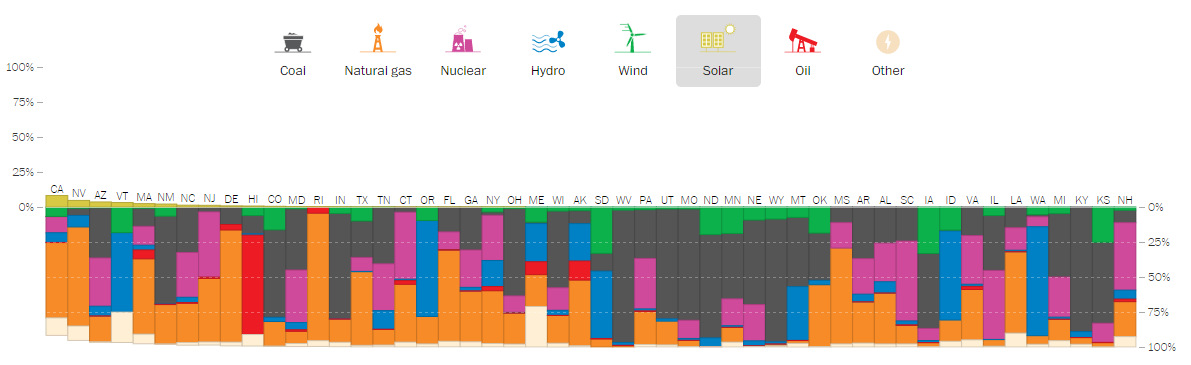
While community solar farms are starting to take off in the United States, solar technology as a whole still does not provide substantial amounts of electricity. It is clear that California is the leader in solar capacity, but it actually only accounts for 10% of total electricity generation in the state.
Coal Power Map
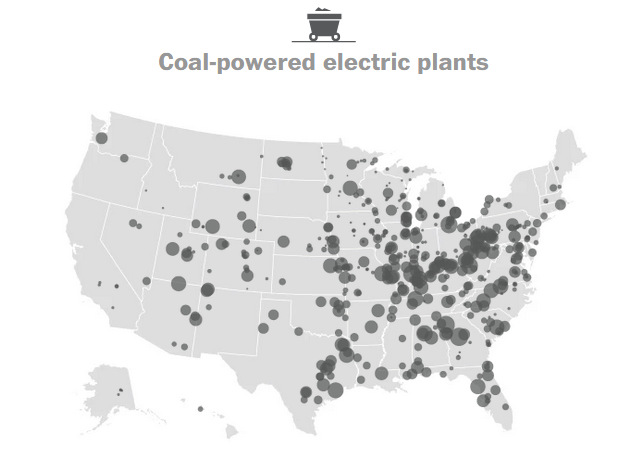
The United States has 400 coal-fired power plants that generate 30% of the nation’s electricity. Coal produces the majority of energy in 13 sates, but thanks to America’s Clean Power Plan, a whopping 111 plants have been shut down since 2015.
Natural Gas Power Map
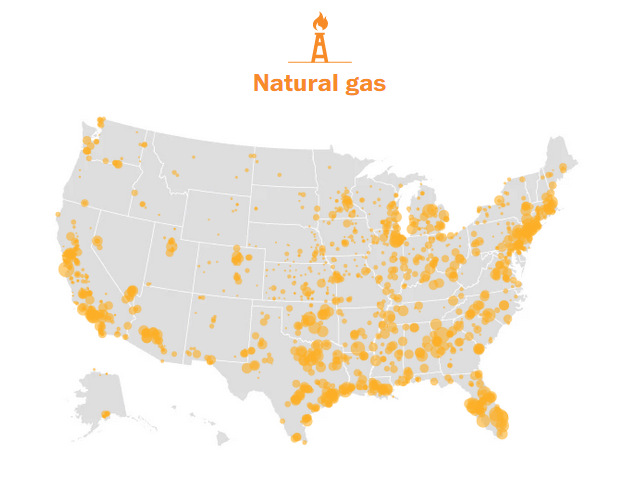
The United States has 1,793 natural gas power plants that generate 34% of the nation’s electricity. Natural gas is the primary source of power in 19 states.
Nuclear Power Map
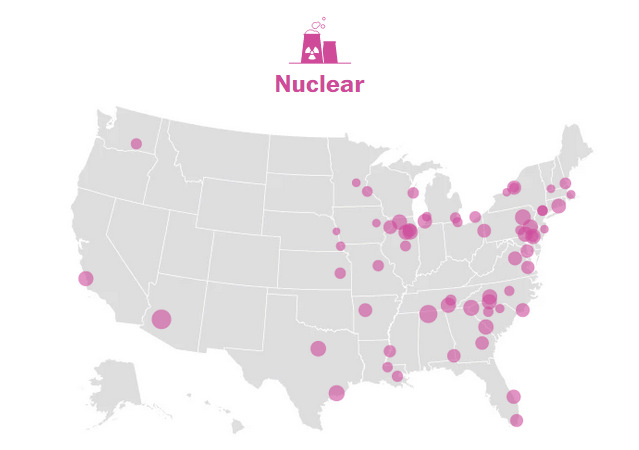
The United States has 61 nuclear reactors that generate 20% of the nation’s electricity. 20 states get no power from nuclear at all.
Hydro Power Map
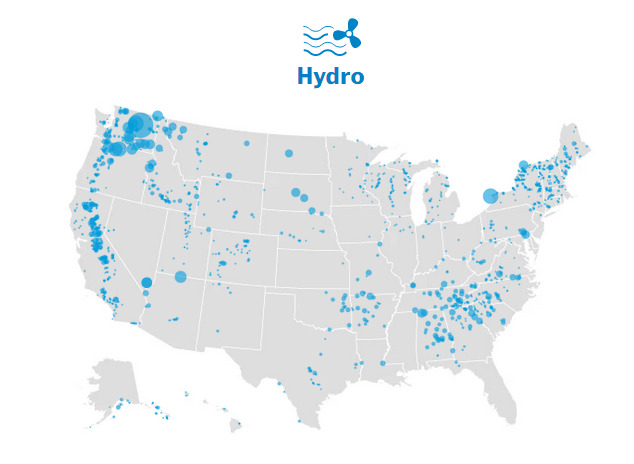
The United States has 1,444 hydroelectric dams that generate 7% of the nation’s electricity. The Grand Coulee Dam in Washington State has 6,809 MW of installed capacity, making it the largest contributor in nameplate capacity in the country. (However, as Forbes notes, actual electricity generated depends on capacity factor.)
Wind Power Map

The United States has 999 wind power plants that generate 6% of the nation’s electricity. The best source for wind is in the Great Plains, where it blows very reliably. Around 2010, China leapfrogged the USA with parabolic wind power growth.
Solar Power Map
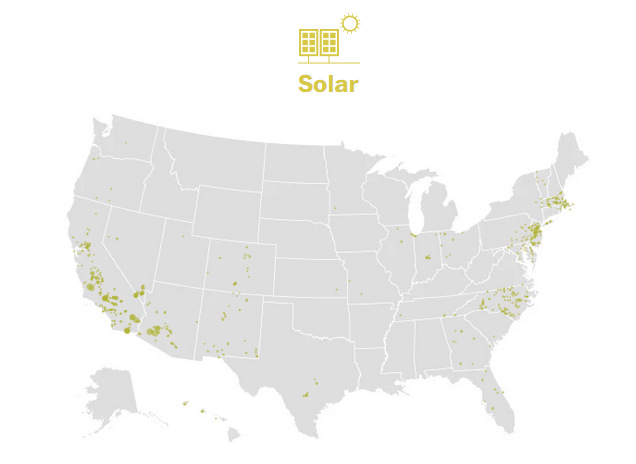
The United States has 1,721 solar power plants that generate 1% of the nation’s electricity.
Oil Power Map
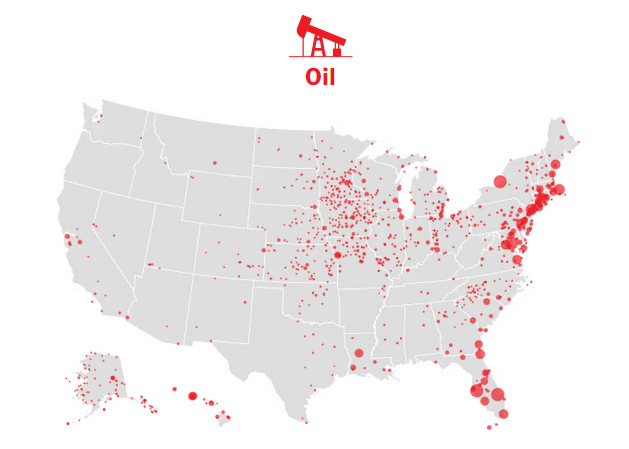
The United States has 1,076 oil-fired power plants that generate less than 1% of the nation’s electricity. America is shaking off its addiction to oil and no longer relies on it for generating electricity because of price swings. Hawaii is the only state to get the majority of its energy from oil.


Energy
The World’s Biggest Nuclear Energy Producers
China has grown its nuclear capacity over the last decade, now ranking second on the list of top nuclear energy producers.


The World’s Biggest Nuclear Energy Producers
This was originally posted on our Voronoi app. Download the app for free on Apple or Android and discover incredible data-driven charts from a variety of trusted sources.
Scientists in South Korea recently broke a record in a nuclear fusion experiment. For 48 seconds, they sustained a temperature seven times that of the sun’s core.
But generating commercially viable energy from nuclear fusion still remains more science fiction than reality. Meanwhile, its more reliable sibling, nuclear fission, has been powering our world for many decades.
In this graphic, we visualized the top producers of nuclear energy by their share of the global total, measured in terawatt hours (TWh). Data for this was sourced from the Nuclear Energy Institute, last updated in August 2022.
Which Country Generates the Most Nuclear Energy?
Nuclear energy production in the U.S. is more than twice the amount produced by China (ranked second) and France (ranked third) put together. In total, the U.S. accounts for nearly 30% of global nuclear energy output.
However, nuclear power only accounts for one-fifth of America’s electricity supply. This is in contrast to France, which generates 60% of its electricity from nuclear plants.
| Rank | Country | Nuclear Energy Produced (TWh) | % of Total |
|---|---|---|---|
| 1 | 🇺🇸 U.S. | 772 | 29% |
| 2 | 🇨🇳 China | 383 | 14% |
| 3 | 🇫🇷 France | 363 | 14% |
| 4 | 🇷🇺 Russia | 208 | 8% |
| 5 | 🇰🇷 South Korea | 150 | 6% |
| 6 | 🇨🇦 Canada | 87 | 3% |
| 7 | 🇺🇦 Ukraine | 81 | 3% |
| 8 | 🇩🇪 Germany | 65 | 2% |
| 9 | 🇯🇵 Japan | 61 | 2% |
| 10 | 🇪🇸 Spain | 54 | 2% |
| 11 | 🇸🇪 Sweden | 51 | 2% |
| 12 | 🇧🇪 Belgium | 48 | 2% |
| 13 | 🇬🇧 UK | 42 | 2% |
| 14 | 🇮🇳 India | 40 | 2% |
| 15 | 🇨🇿 Czech Republic | 29 | 1% |
| N/A | 🌐 Other | 219 | 8% |
| N/A | 🌍 Total | 2,653 | 100% |
Another highlight is how China has rapidly grown its nuclear energy capabilities in the last decade. Between 2016 and 2021, for example, it increased its share of global nuclear energy output from less than 10% to more than 14%, overtaking France for second place.
On the opposite end, the UK’s share has slipped to 2% over the same time period.
Meanwhile, Ukraine has heavily relied on nuclear energy to power its grid. In March 2022, it lost access to its key Zaporizhzhia Nuclear Power Station after Russian forces wrested control of the facility. With six 1,000 MW reactors, the plant is one of the largest in Europe. It is currently not producing any power, and has been the site of recent drone attacks.

-

 Green2 weeks ago
Ranked: Top Countries by Total Forest Loss Since 2001
-

 Travel1 week ago
Ranked: The World’s Top Flight Routes, by Revenue
-

 Technology1 week ago
Ranked: Semiconductor Companies by Industry Revenue Share
-

 Money2 weeks ago
Which States Have the Highest Minimum Wage in America?
-

 Real Estate2 weeks ago
Ranked: The Most Valuable Housing Markets in America
-

 Markets2 weeks ago
Charted: Big Four Market Share by S&P 500 Audits
-

 AI2 weeks ago
The Stock Performance of U.S. Chipmakers So Far in 2024
-

 Automotive2 weeks ago
Almost Every EV Stock is Down After Q1 2024