Misc
Mapped: Second Primary Languages Around the World

Mapped: Second Primary Languages Around the World
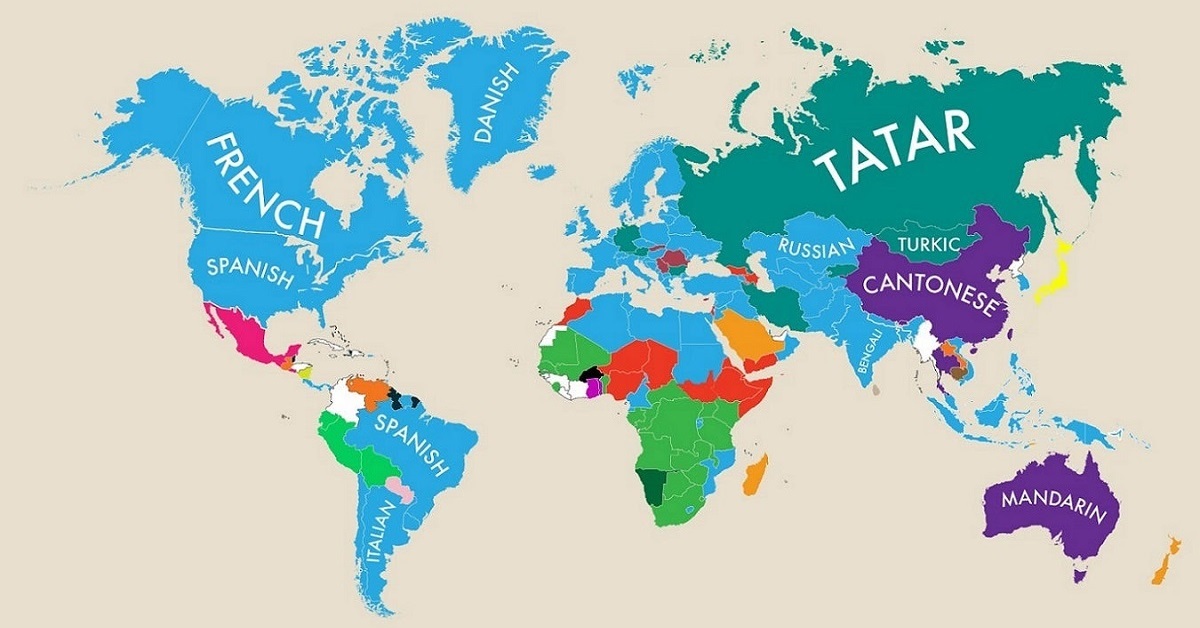
After the primary language, what second languages are used as native tongues in your country?
The answer reveals a lot about history and location. Whether through immigration, colonization, or local culture, a primary language can either spread around the world or remain rooted in place.
This map from MoveHub shows the second most commonly spoken primary language in most countries, using data from the CIA World Factbook and Wikipedia as of February 2021.
The Difference Between Primary and Secondary Languages
First, it’s important to differentiate between primary languages and secondary languages.
A primary language—also known as a first or native language—is the language we use most frequently to communicate. These are languages we are usually born with, have a lot of exposure to, and use at home.
On the other hand, a secondary language is one we learn or pick up after our primary language. In many countries, English is the most commonly learned, with close to 1 billion speakers.
But a map of common second languages can simply show just how many countries prioritize learning English, the de-facto international language in many organizations. Instead, this map highlights the movement of people by showing the second-most common primary language.
The Second Most Common Primary Languages by Country
Even when filtering by primary language use, however, English and other Indo-European languages dominate the world.
With 55 countries speaking it as the second-most common primary language, English came out on top.
| Top 10 Most Popular Second Primary Languages | Number of Countries |
|---|---|
| English | 55 |
| French | 14 |
| Russian | 13 |
| Spanish | 8 |
| Creole | 8 |
| Arabic | 6 |
| Kurdish | 4 |
| Portugese | 4 |
| Italian | 3 |
| Quechua | 3 |
The use of English as a second primary language was primarily concentrated in Western Europe, Northern Africa, and Southeast Asia and Oceania.
Similarly to second-place French with 14 countries and third-place Russian with 13 countries, English was most common in proximity to English-speaking countries or where there was a history of immigration.
Other second-most common primary languages highlighted different cultures within countries, such as China’s second-most common language Cantonese. Alternatively, they showed the primary indigenous language before colonization, such as the Quechua languages in South America.
What other interesting or surprising language patterns can you spot in the map above?
Misc
How Hard Is It to Get Into an Ivy League School?
We detail the admission rates and average annual cost for Ivy League schools, as well as the median SAT scores required to be accepted.

How Hard Is It to Get Into an Ivy League School?
This was originally posted on our Voronoi app. Download the app for free on iOS or Android and discover incredible data-driven charts from a variety of trusted sources.
Ivy League institutions are renowned worldwide for their academic excellence and long-standing traditions. But how hard is it to get into one of the top universities in the U.S.?
In this graphic, we detail the admission rates and average annual cost for Ivy League schools, as well as the median SAT scores required to be accepted. The data comes from the National Center for Education Statistics and was compiled by 24/7 Wall St.
Note that “average annual cost” represents the net price a student pays after subtracting the average value of grants and/or scholarships received.
Harvard is the Most Selective
The SAT is a standardized test commonly used for college admissions in the United States. It’s taken by high school juniors and seniors to assess their readiness for college-level academic work.
When comparing SAT scores, Harvard and Dartmouth are among the most challenging universities to gain admission to. The median SAT scores for their students are 760 for reading and writing and 790 for math. Still, Harvard has half the admission rate (3.2%) compared to Dartmouth (6.4%).
| School | Admission rate (%) | SAT Score: Reading & Writing | SAT Score: Math | Avg Annual Cost* |
|---|---|---|---|---|
| Harvard University | 3.2 | 760 | 790 | $13,259 |
| Columbia University | 3.9 | 750 | 780 | $12,836 |
| Yale University | 4.6 | 760 | 780 | $16,341 |
| Brown University | 5.1 | 760 | 780 | $26,308 |
| Princeton University | 5.7 | 760 | 780 | $11,080 |
| Dartmouth College | 6.4 | 760 | 790 | $33,023 |
| University of Pennsylvania | 6.5 | 750 | 790 | $14,851 |
| Cornell University | 7.5 | 750 | 780 | $29,011 |
*Costs after receiving federal financial aid.
Additionally, Dartmouth has the highest average annual cost at $33,000. Princeton has the lowest at $11,100.
While student debt has surged in the United States in recent years, hitting $1.73 trillion in 2023, the worth of obtaining a degree from any of the schools listed surpasses mere academics. This is evidenced by the substantial incomes earned by former students.
Harvard grads, for example, have the highest average starting salary in the country, at $91,700.
-

 Real Estate2 weeks ago
Visualizing America’s Shortage of Affordable Homes
-

 Technology1 week ago
Ranked: Semiconductor Companies by Industry Revenue Share
-

 Money1 week ago
Which States Have the Highest Minimum Wage in America?
-

 Real Estate1 week ago
Ranked: The Most Valuable Housing Markets in America
-

 Business2 weeks ago
Charted: Big Four Market Share by S&P 500 Audits
-

 AI2 weeks ago
The Stock Performance of U.S. Chipmakers So Far in 2024
-

 Misc2 weeks ago
Almost Every EV Stock is Down After Q1 2024
-

 Money2 weeks ago
Where Does One U.S. Tax Dollar Go?

