Markets
This Map Shows the Most Extreme Comparison of Population Density We’ve Seen
You may have heard that the majority of the world’s population actually lives within a relatively small circle that covers China, India, Japan, and other parts of Southeast Asia.
That’s a pretty extreme example of population density – but here’s one that is even more impressive.
It’s quite simple actually: it compares parts of the most expansive regions (Canada, Russia, non-coastal USA, Greenland, Australia, and others) with a tiny chunk of land that holds close to 400 million people.
An Extreme Comparison of Population Density
The following image comes to us from Metrocosm, the website of data visualization expert Max Galka.
Bangladesh and three provinces in India, which are highlighted in red, take up just 160,000 sq. mi (415,000 sq. km) – that’s smaller than California. Together they hold more population than all of the blue territories on the map.
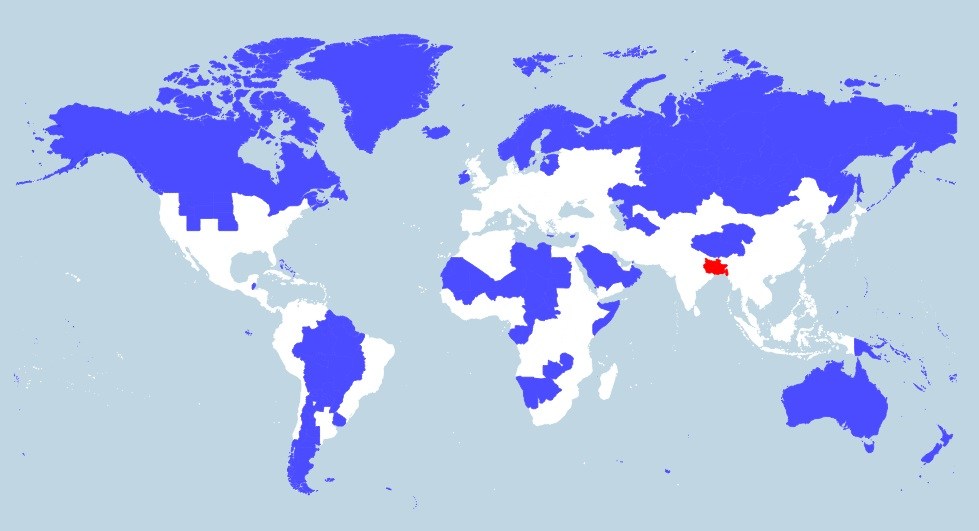
That’s right, the blue area contains the entirety of many significant countries, such as Canada, Australia, Norway, Sweden, and Saudi Arabia. The blue even includes parts of China, the United States, and most of Russia.
Getting More Extreme
Here’s the kicker – the disparity is only getting more intense. Take a look at the following map of the fastest growing cities, showing the rate of new citizens per hour:
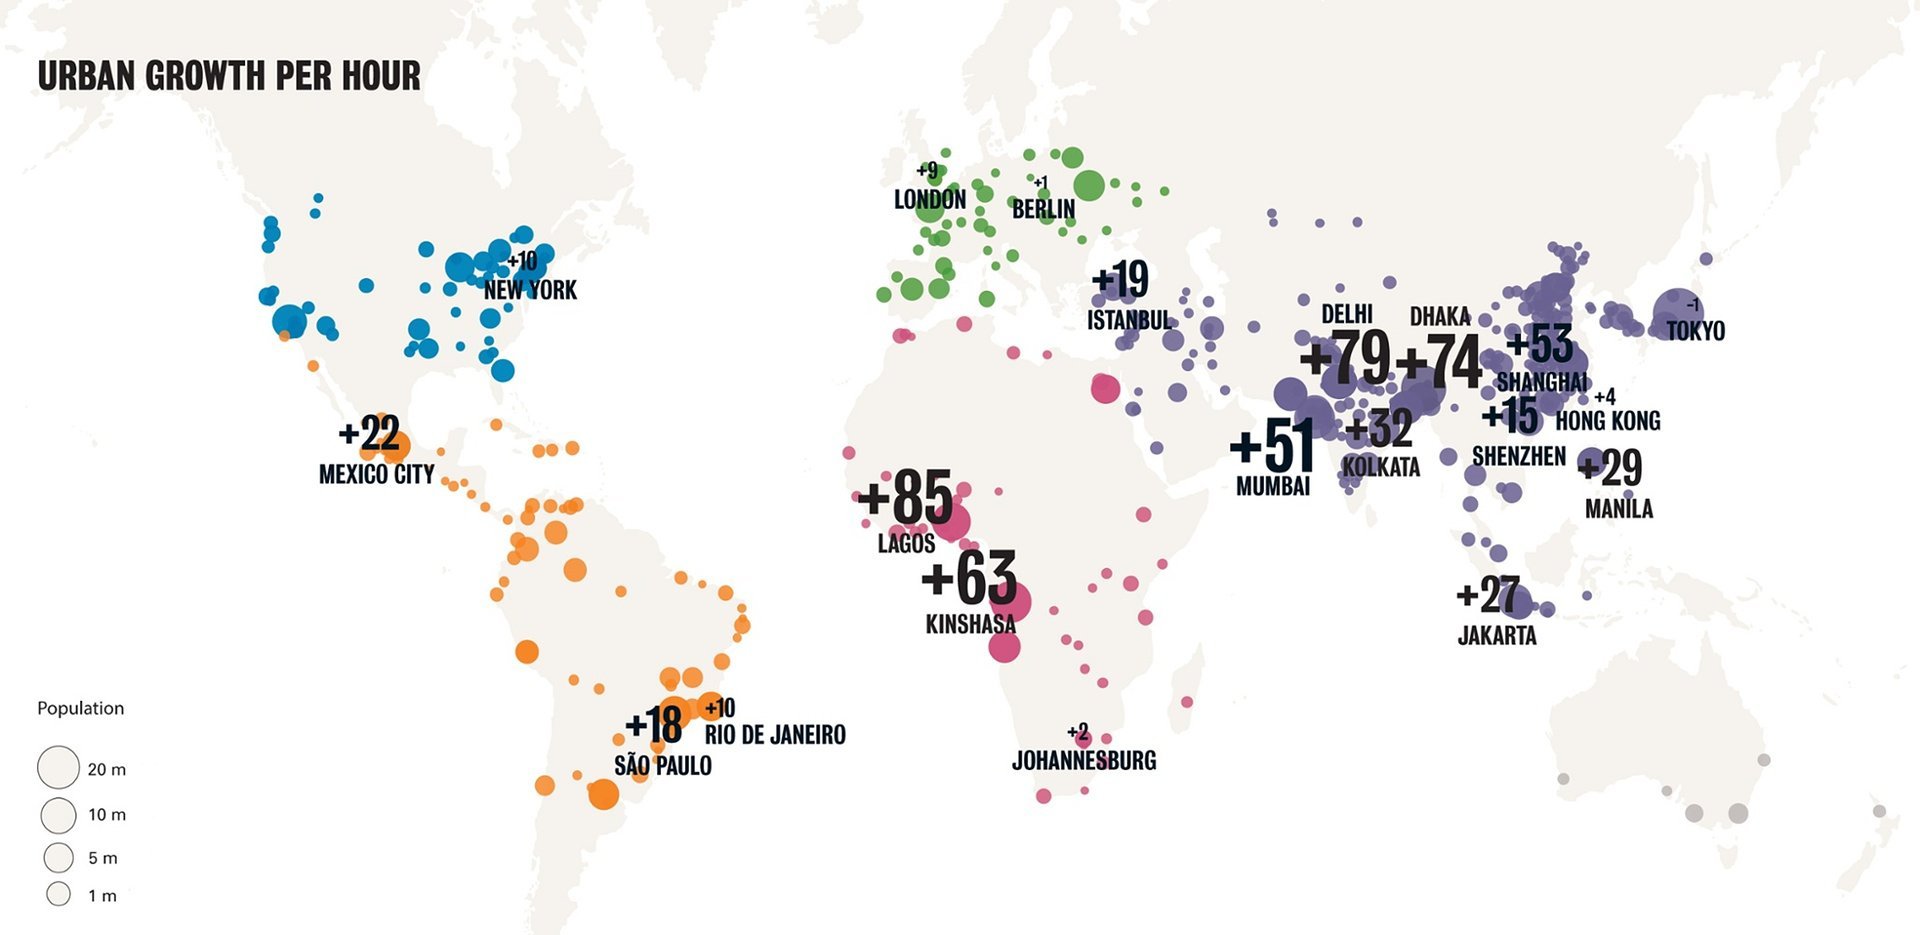
Dhaka, the largest city in Bangladesh, is one of the fastest growing cities in the world with a growth rate of 74 people per hour. Kolkata (India) is also up there, adding 32 citizens every hour.
Meanwhile, the cities within the blue area of the original map do not have the same kind of growth happening at all.
For the Numbers Geeks
Here are the original calculations, from Metrocosm, for the blue and red areas of the original map in case you are interested. It’s worth noting that the data was retrieved in 2015, so it is slightly out of date.
The “Blue” Regions
| Jurisdiction | Region | Population |
|---|---|---|
| Canada | All | 35,010,000 |
| Saudi Arabia | All | 28,123,000 |
| Australia | All | 22,280,000 |
| Russia | Siberian Federal District | 19,254,300 |
| Niger | All | 18,124,000 |
| Kazakhstan | All | 16,137,000 |
| Mali | All | 14,478,000 |
| Zambia | All | 14,440,000 |
| Russia | Northwestern Federal District | 13,583,800 |
| Chad | All | 12,620,000 |
| Russia | Ural Federal District | 12,082,700 |
| Bolivia | All | 10,610,000 |
| Somalia | All | 10,295,000 |
| Sweden | All | 9,437,000 |
| Brazil | Pará | 8,073,924 |
| Papua New Guinea | All | 7,440,000 |
| Paraguay | All | 6,844,000 |
| Russia | Far Eastern Federal District | 6,291,900 |
| Libyan Arab Jamahiriya | All | 5,918,217 |
| China | Qinghai | 5,626,722 |
| Turkmenistan | All | 5,411,000 |
| Finland | All | 5,408,000 |
| Norway | All | 4,985,000 |
| Ireland | All | 4,804,000 |
| New Zealand | All | 4,436,000 |
| Central African Republic | All | 4,191,429 |
| Brazil | Amazonas | 3,873,743 |
| Mauritania | All | 3,623,000 |
| Republic of the Congo | All | 3,609,851 |
| Uruguay | All | 3,412,000 |
| Brazil | Mato Grosso | 3,224,357 |
| Lithuania | All | 3,173,000 |
| Oman | All | 3,110,000 |
| China | Tibet | 3,002,166 |
| United States | Utah | 2,942,902 |
| United States | Kansas | 2,904,021 |
| Mongolia | All | 2,809,000 |
| Brazil | Mato Grosso do Sul | 2,619,657 |
| Namibia | All | 2,352,000 |
| Latvia | All | 2,210,000 |
| Botswana | All | 2,068,000 |
| United States | Nebraska | 1,881,503 |
| Brazil | Rondônia | 1,748,531 |
| Argentina | Mendoza | 1,741,610 |
| United States | Idaho | 1,634,464 |
| Gabon | All | 1,597,000 |
| Brazil | Tocantins | 1,496,880 |
| Estonia | All | 1,338,000 |
| Argentina | Salta | 1,215,207 |
| Argentina | Chaco | 1,053,466 |
| United States | Montana | 1,023,579 |
| Argentina | Corrientes | 993,338 |
| Cyprus | All | 911,000 |
| Argentina | Santiago del Estero | 896,461 |
| United States | South Dakota | 853,175 |
| Fiji | All | 828,046 |
| Brazil | Acre | 790,101 |
| Guyana | All | 757,000 |
| Brazil | Amapá | 750,912 |
| United States | North Dakota | 739,482 |
| United States | Alaska | 736,732 |
| Argentina | San Juan | 680,427 |
| Argentina | Jujuy | 672,260 |
| Argentina | Río Negro | 633,374 |
| Greece | Crete | 620,000 |
| United States | Wyoming | 584,153 |
| Argentina | Neuquén | 550,334 |
| Suriname | All | 540,000 |
| Argentina | Formosa | 527,895 |
| Western Sahara | All | 507,160 |
| Argentina | Chubut | 506,668 |
| Brazil | Roraima | 496,936 |
| Solomon Islands | All | 472,419 |
| Argentina | San Luis | 431,588 |
| Argentina | Catamarca | 367,820 |
| Bahamas | All | 360,000 |
| Iceland | All | 347,000 |
| Belize | All | 335,000 |
| Argentina | La Rioja | 331,847 |
| France | Corsica | 322,000 |
| Argentina | La Pampa | 316,940 |
| Argentina | Santa Cruz | 272,524 |
| Vanuatu | All | 267,000 |
| New Caledonia | All | 266,000 |
| French Guiana | All | 250,377 |
| Guam | All | 165,124 |
| Chile | Magallanes y la Antártica Chilena | 159,152 |
| Argentina | Tierra del Fuego, Antártida e Islas del Atlántico Sur | 126,190 |
| Micronesia | All | 103,549 |
| Kiribati | All | 102,351 |
| Chile | Aysén del General Carlos Ibáñez del Campo | 98,413 |
| Greenland | All | 57,475 |
| Northern Mariana Islands | All | 53,855 |
| Galapagos | All | 25,000 |
| Palau | All | 20,918 |
| Falkland Islands (Malvinas) | All | 3,000 |
| Svalbard | All | 2,642 |
| Norfolk Island | All | 2,169 |
| French Southern and Antarctic Lands | All | 0 |
| South Georgia South Sandwich Islands | All | 0 |
The “Red” Regions
| Jurisdiction | Region | Population |
|---|---|---|
| Bangladesh | All | 172,019,000 |
| India | Bihar | 99,000,000 |
| India | West Bengal | 90,320,000 |
| India | Jharkhand | 32,000,000 |


Markets
U.S. Debt Interest Payments Reach $1 Trillion
U.S. debt interest payments have surged past the $1 trillion dollar mark, amid high interest rates and an ever-expanding debt burden.


U.S. Debt Interest Payments Reach $1 Trillion
This was originally posted on our Voronoi app. Download the app for free on iOS or Android and discover incredible data-driven charts from a variety of trusted sources.
The cost of paying for America’s national debt crossed the $1 trillion dollar mark in 2023, driven by high interest rates and a record $34 trillion mountain of debt.
Over the last decade, U.S. debt interest payments have more than doubled amid vast government spending during the pandemic crisis. As debt payments continue to soar, the Congressional Budget Office (CBO) reported that debt servicing costs surpassed defense spending for the first time ever this year.
This graphic shows the sharp rise in U.S. debt payments, based on data from the Federal Reserve.
A $1 Trillion Interest Bill, and Growing
Below, we show how U.S. debt interest payments have risen at a faster pace than at another time in modern history:
| Date | Interest Payments | U.S. National Debt |
|---|---|---|
| 2023 | $1.0T | $34.0T |
| 2022 | $830B | $31.4T |
| 2021 | $612B | $29.6T |
| 2020 | $518B | $27.7T |
| 2019 | $564B | $23.2T |
| 2018 | $571B | $22.0T |
| 2017 | $493B | $20.5T |
| 2016 | $460B | $20.0T |
| 2015 | $435B | $18.9T |
| 2014 | $442B | $18.1T |
| 2013 | $425B | $17.2T |
| 2012 | $417B | $16.4T |
| 2011 | $433B | $15.2T |
| 2010 | $400B | $14.0T |
| 2009 | $354B | $12.3T |
| 2008 | $380B | $10.7T |
| 2007 | $414B | $9.2T |
| 2006 | $387B | $8.7T |
| 2005 | $355B | $8.2T |
| 2004 | $318B | $7.6T |
| 2003 | $294B | $7.0T |
| 2002 | $298B | $6.4T |
| 2001 | $318B | $5.9T |
| 2000 | $353B | $5.7T |
| 1999 | $353B | $5.8T |
| 1998 | $360B | $5.6T |
| 1997 | $368B | $5.5T |
| 1996 | $362B | $5.3T |
| 1995 | $357B | $5.0T |
| 1994 | $334B | $4.8T |
| 1993 | $311B | $4.5T |
| 1992 | $306B | $4.2T |
| 1991 | $308B | $3.8T |
| 1990 | $298B | $3.4T |
| 1989 | $275B | $3.0T |
| 1988 | $254B | $2.7T |
| 1987 | $240B | $2.4T |
| 1986 | $225B | $2.2T |
| 1985 | $219B | $1.9T |
| 1984 | $205B | $1.7T |
| 1983 | $176B | $1.4T |
| 1982 | $157B | $1.2T |
| 1981 | $142B | $1.0T |
| 1980 | $113B | $930.2B |
| 1979 | $96B | $845.1B |
| 1978 | $84B | $789.2B |
| 1977 | $69B | $718.9B |
| 1976 | $61B | $653.5B |
| 1975 | $55B | $576.6B |
| 1974 | $50B | $492.7B |
| 1973 | $45B | $469.1B |
| 1972 | $39B | $448.5B |
| 1971 | $36B | $424.1B |
| 1970 | $35B | $389.2B |
| 1969 | $30B | $368.2B |
| 1968 | $25B | $358.0B |
| 1967 | $23B | $344.7B |
| 1966 | $21B | $329.3B |
Interest payments represent seasonally adjusted annual rate at the end of Q4.
At current rates, the U.S. national debt is growing by a remarkable $1 trillion about every 100 days, equal to roughly $3.6 trillion per year.
As the national debt has ballooned, debt payments even exceeded Medicaid outlays in 2023—one of the government’s largest expenditures. On average, the U.S. spent more than $2 billion per day on interest costs last year. Going further, the U.S. government is projected to spend a historic $12.4 trillion on interest payments over the next decade, averaging about $37,100 per American.
Exacerbating matters is that the U.S. is running a steep deficit, which stood at $1.1 trillion for the first six months of fiscal 2024. This has accelerated due to the 43% increase in debt servicing costs along with a $31 billion dollar increase in defense spending from a year earlier. Additionally, a $30 billion increase in funding for the Federal Deposit Insurance Corporation in light of the regional banking crisis last year was a major contributor to the deficit increase.
Overall, the CBO forecasts that roughly 75% of the federal deficit’s increase will be due to interest costs by 2034.

-

 Real Estate2 weeks ago
Visualizing America’s Shortage of Affordable Homes
-

 Technology1 week ago
Ranked: Semiconductor Companies by Industry Revenue Share
-

 Money1 week ago
Which States Have the Highest Minimum Wage in America?
-

 Real Estate1 week ago
Ranked: The Most Valuable Housing Markets in America
-

 Business2 weeks ago
Charted: Big Four Market Share by S&P 500 Audits
-

 AI2 weeks ago
The Stock Performance of U.S. Chipmakers So Far in 2024
-

 Misc2 weeks ago
Almost Every EV Stock is Down After Q1 2024
-

 Money2 weeks ago
Where Does One U.S. Tax Dollar Go?