Politics
The Least and Most Trusted News Sources in America
Which news sources are the most trustworthy?
This seems like a simple question – but in the “fake news” era, things haven’t been so straightforward. As a result, the public’s level of trust in mass media has fallen to a low of just 32%.
Examining The Trust Spectrum
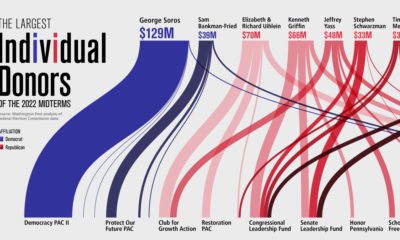
A new survey by the Trusting News Project helps shed more light on the state of trust in media, revealing the attitudes of 8,728 people in the United States. Administered through 28 media outlets around the country, the survey asked respondents how trusting they are of the media, whether they financially support news organizations, and which outlets are the most (and least) trustworthy.
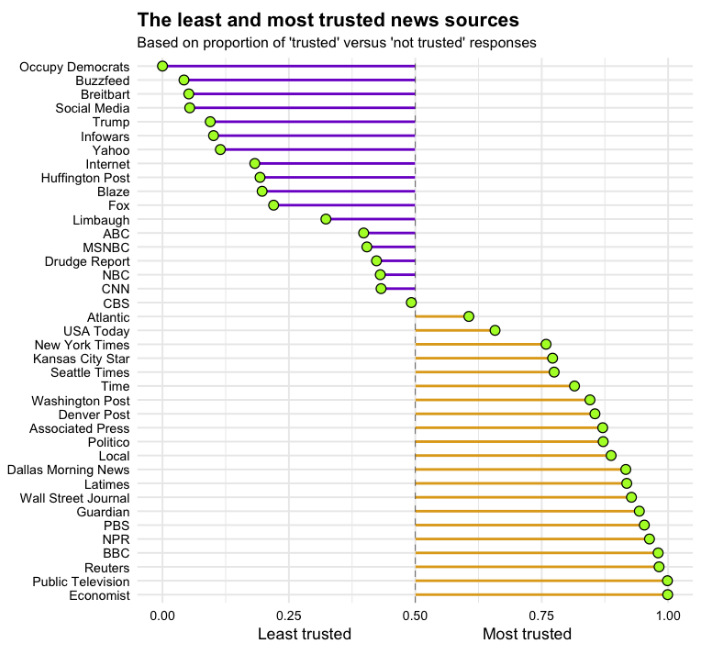
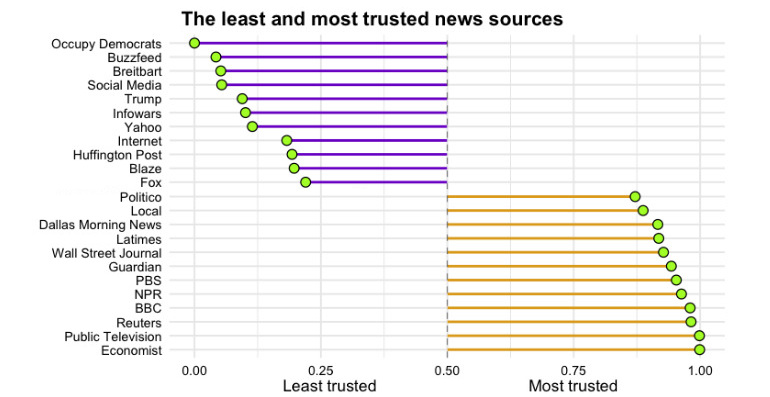
Here are results to the question about trustworthiness of specific news sources:
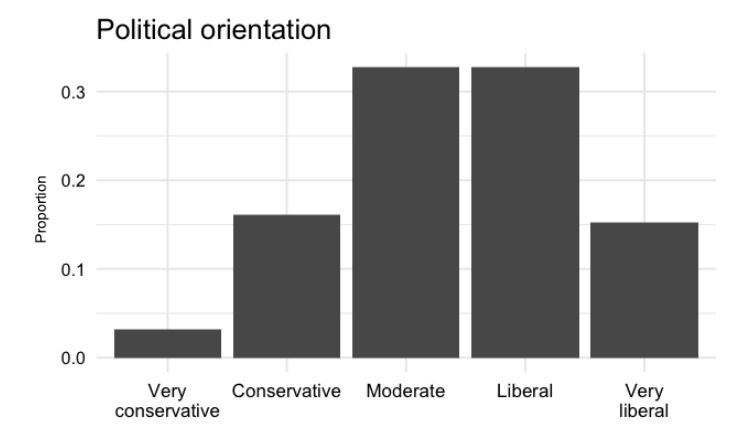
Before we dive into the results, it’s worth noting that respondents were self-selected and tend to skew to the liberal side of the political spectrum. More on this later in the post, but keep it in mind.
High Trust, Low Trust
According to the survey respondents, The Economist is the most trustworthy news source in media.
On the far opposite side of the spectrum? It’s Occupy Democrats, an extreme left advocacy group that claims to be the “new counterbalance to the Republican Tea Party”.
Interestingly, both The Economist and Occupy Democrats have close to the same amount of Facebook likes (8.2 million vs. 6.7 million), which shows that despite polar opposite perceptions, people are willing to grant an audience to both groups.
Also scoring well for trust included outlets such as Reuters, NPR, The Wall Street Journal, Politico, and The Guardian. Meanwhile, bad trust scores went to Buzzfeed, Breitbart, Infowars, Yahoo, and The Huffington Post.
Trust By Political Skew
It’s also worth breaking down respondents into groups based on political orientation, to see what differences this can point out regarding trust and the level of financial support being provided to news organizations.
On the following graph, the X-axis shows age groups, while the Y-axis shows levels of trust (higher is more), as well as the number of news organizations respondents claim to financially support (higher is more).
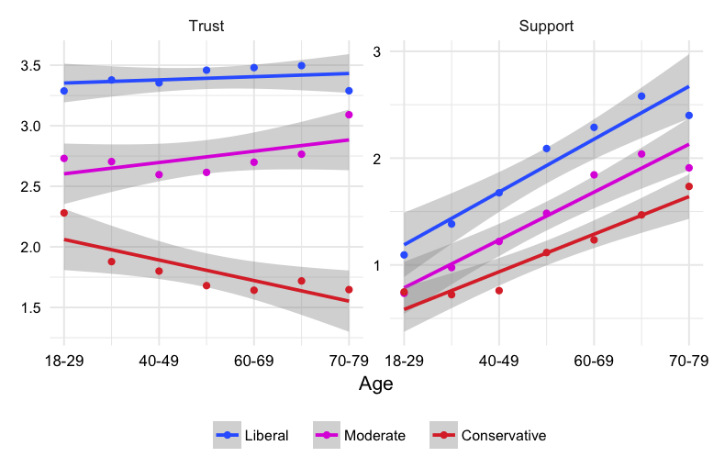
For people that identify as liberals or moderates, trust of news outlets is positively correlated with age. Interestingly, for conservatives, trust in media starts low and seems to decrease with age.
Audience Biases
As mentioned earlier, although the sample size was big (>8,000), there are a few biases worth noting:
- Survey respondents were not randomly selected, and voluntarily filled out the survey.
- Survey respondents tended to be geographically near the 28 newsrooms, many of which were local, that made the survey available on their websites.
- In terms of political orientation, the audience skews towards liberals. (See below diagram).
And while the audience may not be fully representative of the American public, the survey definitely does provide interesting insight on trust in media. Get access to the full report by clicking here.


Economy
The Bloc Effect: International Trade with Geopolitical Allies on the Rise
Rising geopolitical tensions are shaping the future of international trade, but what is the effect on trading among G7 and BRICS countries?


The Bloc Effect: International Trade with Allies on the Rise
International trade has become increasingly fragmented over the last five years as countries have shifted to trading more with their geopolitical allies.
This graphic from The Hinrich Foundation, the first in a three-part series covering the future of trade, provides visual context to the growing divide in trade in G7 and pre-expansion BRICS countries, which are used as proxies for geopolitical blocs.
Trade Shifts in G7 and BRICS Countries
This analysis uses IMF data to examine differences in shares of exports within and between trading blocs from 2018 to 2023. For example, we looked at the percentage of China’s exports with other BRICS members as well as with G7 members to see how these proportions shifted in percentage points (pp) over time.
Countries traded nearly $270 billion more with allies in 2023 compared to 2018. This shift came at the expense of trade with rival blocs, which saw a decline of $314 billion.
Country Change in Exports Within Bloc (pp) Change in Exports With Other Bloc (pp)
🇮🇳 India 0.0 3.9
🇷🇺 Russia 0.7 -3.8
🇮🇹 Italy 0.8 -0.7
🇨🇦 Canada 0.9 -0.7
🇫🇷 France 1.0 -1.1
🇪🇺 EU 1.1 -1.5
🇩🇪 Germany 1.4 -2.1
🇿🇦 South Africa 1.5 1.5
🇺🇸 U.S. 1.6 -0.4
🇯🇵 Japan 2.0 -1.7
🇨🇳 China 2.1 -5.2
🇧🇷 Brazil 3.7 -3.3
🇬🇧 UK 10.2 0.5
All shifts reported are in percentage points. For example, the EU saw its share of exports to G7 countries rise from 74.3% in 2018 to 75.4% in 2023, which equates to a 1.1 percentage point increase.
The UK saw the largest uptick in trading with other countries within the G7 (+10.2 percentage points), namely the EU, as the post-Brexit trade slump to the region recovered.
Meanwhile, the U.S.-China trade dispute caused China’s share of exports to the G7 to fall by 5.2 percentage points from 2018 to 2023, the largest decline in our sample set. In fact, partly as a result of the conflict, the U.S. has by far the highest number of harmful tariffs in place.
The Russia-Ukraine War and ensuing sanctions by the West contributed to Russia’s share of exports to the G7 falling by 3.8 percentage points over the same timeframe.
India, South Africa, and the UK bucked the trend and continued to witness advances in exports with the opposing bloc.
Average Trade Shifts of G7 and BRICS Blocs
Though results varied significantly on a country-by-country basis, the broader trend towards favoring geopolitical allies in international trade is clear.
Bloc Change in Exports Within Bloc (pp) Change in Exports With Other Bloc (pp)
Average 2.1 -1.1
BRICS 1.6 -1.4
G7 incl. EU 2.4 -1.0
Overall, BRICS countries saw a larger shift away from exports with the other bloc, while for G7 countries the shift within their own bloc was more pronounced. This implies that though BRICS countries are trading less with the G7, they are relying more on trade partners outside their bloc to make up for the lost G7 share.
A Global Shift in International Trade and Geopolitical Proximity
The movement towards strengthening trade relations based on geopolitical proximity is a global trend.
The United Nations categorizes countries along a scale of geopolitical proximity based on UN voting records.
According to the organization’s analysis, international trade between geopolitically close countries rose from the first quarter of 2022 (when Russia first invaded Ukraine) to the third quarter of 2023 by over 6%. Conversely, trade with geopolitically distant countries declined.
The second piece in this series will explore China’s gradual move away from using the U.S. dollar in trade settlements.
Visit the Hinrich Foundation to learn more about the future of geopolitical trade

-

 Economy4 hours ago
Economic Growth Forecasts for G7 and BRICS Countries in 2024
The IMF has released its economic growth forecasts for 2024. How do the G7 and BRICS countries compare?
-

 United States1 week ago
Ranked: The Largest U.S. Corporations by Number of Employees
We visualized the top U.S. companies by employees, revealing the massive scale of retailers like Walmart, Target, and Home Depot.
-

 Economy2 weeks ago
Where U.S. Inflation Hit the Hardest in March 2024
We visualized product categories that saw the highest % increase in price due to U.S. inflation as of March 2024.
-

 Economy4 weeks ago
G20 Inflation Rates: Feb 2024 vs COVID Peak
We visualize inflation rates across G20 countries as of Feb 2024, in the context of their COVID-19 pandemic peak.
-

 Economy1 month ago
Mapped: Unemployment Claims by State
This visual heatmap of unemployment claims by state highlights New York, California, and Alaska leading the country by a wide margin.
-

 Economy2 months ago
Confidence in the Global Economy, by Country
Will the global economy be stronger in 2024 than in 2023?


-

 Markets1 week ago
U.S. Debt Interest Payments Reach $1 Trillion
-

 Business2 weeks ago
Charted: Big Four Market Share by S&P 500 Audits
-

 Real Estate2 weeks ago
Ranked: The Most Valuable Housing Markets in America
-

 Money2 weeks ago
Which States Have the Highest Minimum Wage in America?
-

 AI2 weeks ago
Ranked: Semiconductor Companies by Industry Revenue Share
-

 Markets2 weeks ago
Ranked: The World’s Top Flight Routes, by Revenue
-

 Demographics2 weeks ago
Population Projections: The World’s 6 Largest Countries in 2075
-

 Markets2 weeks ago
The Top 10 States by Real GDP Growth in 2023